

 Print
Print The good news this week is that things are starting to get better. Case growth has peaked, at least in the short term, and the case growth rate has ticked down. After last week’s stabilization of the second wave, this progress is the next step. The data indicates that, in many states, outbreaks are being contained, as expected.
At the national level, as of July 29, the number of new cases was about 70,000, almost the same as a week ago. But the daily spread rate has improved a bit, down from just under 2 percent to 1.5 percent per day. Similarly, the number of tests has continued to bounce between 750,000 and 850,000 per day, but the positive rate has dropped to under 8 percent. Control measures imposed in multiple states appear to be working, although (as expected) it will take more time to see further improvement.
Beyond the headline numbers, state-level data continues to improve. Case growth in most of the worst affected states, including California, Arizona, Florida, and Texas, appears to have peaked, as people and governments there have started to reimpose social distancing and other restrictions. Plus, Georgia is stabilizing. These changes show that policy measures can constrain further increases, although this shift will take time.
Overall, the national risks remain under control, as the second wave is showing signs of having peaked. The base case remains that another national shutdown will not be necessary.
While the medical news has been mixed, there has been some good news. Despite some slowing, the economic reopening is still on track, and the financial markets are responding to positive developments. Let’s take a look at the details.
Pandemic growth rate down
Growth rate. Over the past week, the daily case growth rate has ticked down from 1.8 percent to 1.5 percent per day. This movement suggests that even as the case count remains stable, the spread is slowing. At this rate, the case-doubling period is about seven weeks, up from five weeks last week. This leaves the infection curve flatter at a national level, although several states are still showing substantially higher growth rates that could threaten their health care systems.
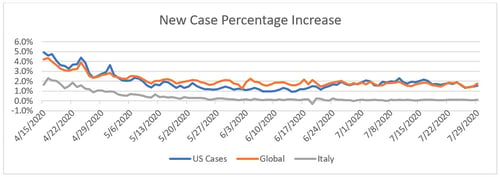
Source: Data from worldometer.com
Daily testing rate. Despite the rise in infections, testing rates have not increased nearly as much and are now at around 750,000 to 805,000 per day, roughly steady over the past week. This is still not yet at the level needed to develop a full understanding of the pandemic, despite the outbreaks in multiple states.
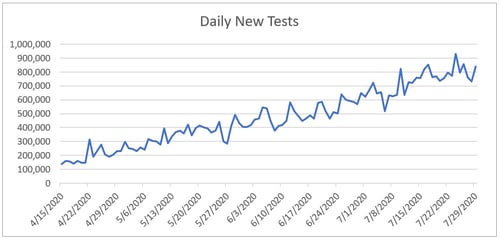
Source: Data from the COVID Tracking Project
Positive test results. We can see this lack of progress by the positive rate on tests. If we look at the percentage of each day’s tests that are positive, lower numbers are better, as we want to be testing everyone and not just those who are obviously sick. The World Health Organization recommends a target of 5 percent or lower; the lower this number gets, the wider the testing is getting. Here, we can see that the positive level has improved, dropping below 8 percent, which is better but still shows that we are largely just testing the people who are sick. Again, this is likely due to the effects of the state-level outbreaks.
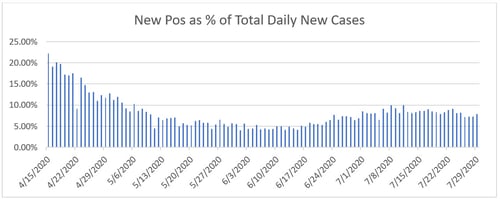
Source: Data from the COVID Tracking Project
New cases per day. The most obvious metric for tracking the virus is daily new cases. Due to the state-level outbreaks, the number of new cases per day has stayed steady at around 70,000 per day, down a bit from the peak. This range has been steady for the past couple of weeks. The new case growth comes from a wide range of states now, although the worst hit have now peaked.
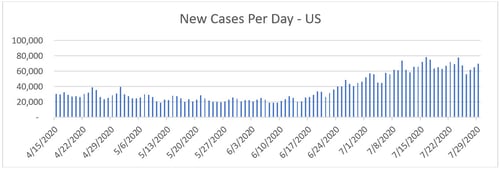
Source: Data from worldometer.com
Total active cases. Active case growth has also ticked up over the past week, although at a slower rate. While new infections are still outpacing recoveries, the gap is narrowing.
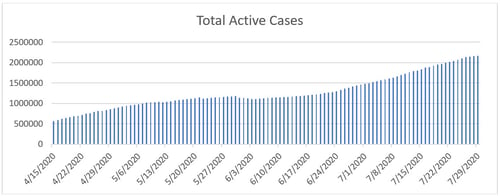
Source: Data from worldometer.com
Overall, the pandemic continues to be moderate at the national level and is showing signs of slow improvement. While major state outbreaks are still threatening local health care systems, in many states, we see significant drops in case growth. The good news here is that policy and behavioral changes are underway in most of the affected states, which appear to be moderating case growth. The risk of a national shutdown is receding as the breadth and speed of the state-level outbreaks are peaking and starting to decline.
Economic recovery stabilizes after weakness
Signs of weakness. The economic news is better, with the recovery continuing. That said, there are signs of weakness. The most recent initial jobless claims report came in higher than expected, and continuing unemployment claims rose as well. Consumer confidence has ticked down a bit, although it remains above the recent bottoms. And while the most recent retail sales report showed that consumer retail spending has now recovered to pre-pandemic levels, higher-frequency spending data has softened.
The chart below illustrates higher-frequency spending data, showing consumer spending down from the post-pandemic peak in mid-June. This is something to watch, but note that the decline has moderated in recent weeks. Overall, this chart shows that while the economic recovery has not been derailed by the rebound in new viral cases, it has been slowed.
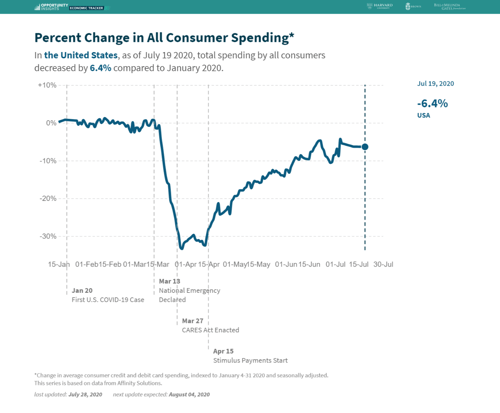
Source: tracktherecovery.org
Finally, we can see similar signs of a slowdown in the recovery in this composite of many indicators from J. P. Morgan.
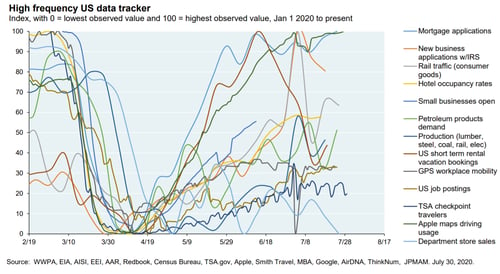
Source: J. P. Morgan
The risks. Although the reopening is going better than expected and is clearly having positive economic effects, we also certainly face risks. The biggest is that as the local outbreaks have turned into local shutdowns, this has had negative economic effects, which is slowing the recovery.
Another potential risk is that, even as case growth moderates, consumers may be slower to return and spending growth will improve more slowly than we have seen so far in the recovery. While the slowdown so far has been limited, despite the outbreaks, a deeper drop remains a risk. That said, spending remains strong so far and has come back after some weakness. So, the hard data remains positive.
Financial markets steady
For the financial markets, the past week was volatile but steady overall. On the medical front, markets have responded to the stabilization in the new case count and encouraging news on vaccine development. On the economic front, corporate earnings are coming in somewhat better than expected. Overall, markets remain supported by ongoing positive developments, but they are very aware of the risks. The good news is that as we get more data, markets seem to be developing a firmer foundation.
Second wave has likely peaked
The real takeaway from this past week is that the second wave has likely peaked, and the data suggests that this wave will be brought under control over the next several weeks just as the first wave was. If the outbreaks start to worsen and spread, it could put the recovery at risk—but this outcome looks even less likely this week than last. The most likely case appears to be continued recovery.


