

 Print
Print As we did last week, I’d like to provide an update on where we are in the coronavirus crisis. This week, the news has generally been good. The virus continues to come under control, with the growth rate slowing (although the case count has not declined as much). Some states are reopening their economies, which will give us valuable data and should help with employment. Finally, the markets have continued to rally but may have gotten a bit ahead of themselves. Let’s take a closer look.
The virus: Continued progress
Growth rate. As of this writing (April 30, 2020), the daily case growth rate has been below 3 percent per day for four days in a row. This result is down from between 3 percent and 4 percent last week, so it represents continued progress. In fact, we’ve seen the lowest growth rate since the end of February. We continue to be about two weeks behind Italy, which suggests the growth rate will continue to decline in the coming weeks.
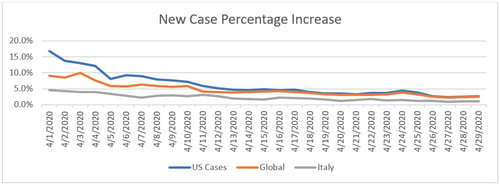
Source: Data from worldometer.com
New cases. The new cases have also declined, although in a less steady fashion. Case counts briefly broke below the 25,000 per day level, but they have since bounced back to between 25,000 and 30,000 per day, as a larger base case level has outweighed the slower growth rate. A sustained drop below 25,000 per day is the next milestone. Nonetheless, the downward trend seems reasonably consistent over the past month, suggesting we should see the number of new cases per day continue to inch down.
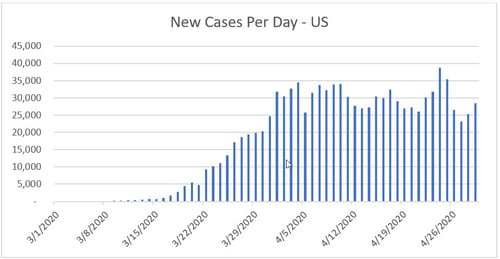
Source: Data from worldometer.com
Economy: States starting to reopen
Easing of social distancing restrictions. The real progress in controlling the virus has led to talk of easing social distancing restrictions and reopening the economy—and several states have started doing just that. While there are concerns that this shift could lead to faster spread of the virus, that will not be apparent for a few weeks when new infections actually show up in the data. So, a continued decline in the spread of the virus over the next couple of weeks will not be an argument for (or against) any such opening.
Increase in testing. Another concern is that when states do open up, more comprehensive testing will be needed to track and isolate infected and exposed people. Opening up essentially means switching from isolating everyone to isolating only those who are sick or at risk. To do so, we need to know who those individuals are. The only way to make this identification is through widespread testing. In the past week, encouragingly, we have seen testing increase substantially, to around or above 200,000 per day (up from 150,000 per day last week). This increase is real progress, and it looks likely to continue.
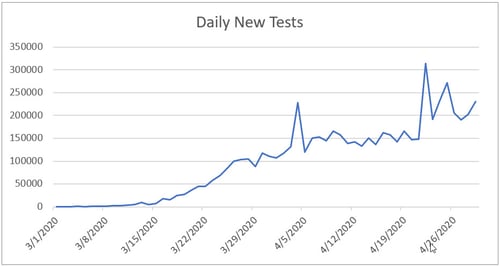
Source: Data from the COVID Tracking Project
We aren’t yet certain about how many tests per day we will need, but initial estimates were in the 1 million per day range. That number now looks too low. In any event, the current test run rate remains too low to support any kind of meaningful surveillance operation to support reopening economies, but it is at least moving in the right direction.
Positive test results still high. Another way to look at where we are now is to examine the percentage of tests that are coming back positive. Ideally, if everyone were being tested, this number should be quite low. In fact, between 10 percent and 15 percent of all tests are coming back positive, which suggests two things. First, the tests are primarily being given to people who are likely sick with the virus. Second, given the limited availability, most people who might have the virus are not being tested. The level of positive results should likely be 5 percent or below. Until we get down to that level, we will not have enough data to reopen economies without risking another wave of the virus. Again, while we are not there yet, we continue to make material progress.
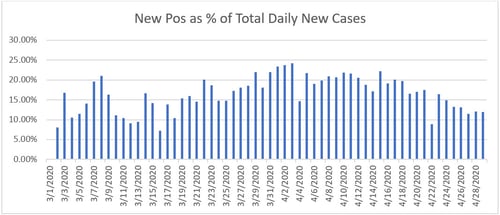
Source: Data from the COVID Tracking Project
Headed in right direction. We have made real progress, but we do not yet have the virus under control. While the daily case growth rate is down to less than 3 percent, that still means that—absent further reductions—the total number of cases will double in the next four weeks or so. It should also be said that the current gains are not locked in stone. Premature policy changes or a failure of people to observe prudent behavior could unleash the virus again, which is a real risk of the current partial reopening of many states. We are headed in the right direction, but we are not there yet. We must keep that in mind as we look at the markets.
The markets: What happens next?
Over the past several weeks, markets had the fastest onset of a bear market in history, followed by the fastest recovery into a bull market in history. In the past week alone, the S&P 500 is up about 4 percent. This kind of volatility is historic. But since it is unprecedented, we can’t really look back at history for guidance as to what happens next. We can, however, look at the present to see what that tells us about the market today.
Corporate earnings. The best way to do so is to look at what the market itself is telling us by comparing the recent volatility in stock prices with the expected changes in the underlying fundamentals: corporate earnings. The problem here is that we don’t know what earnings will be over the next year or two. But we do have estimates, and we can at least use those as a basis to figure out just how cheap—or expensive—stocks are based on those expectations. That calculation can provide a historical baseline.
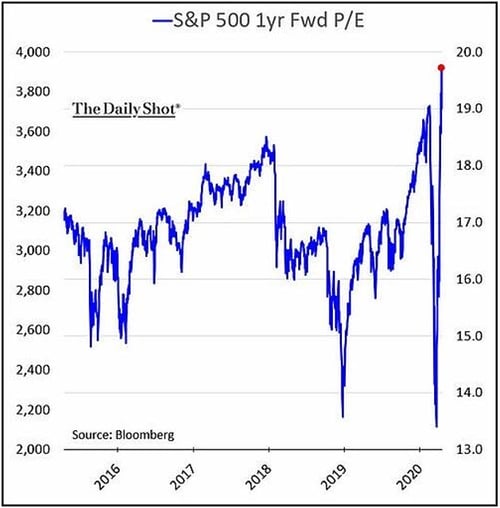
Using that baseline, we can see that when the markets dropped, based on the earnings expectations then, they became the cheapest since 2015. Since then, however, a combination of a market recovery and declining earnings expectations has resulted in the market being even more expensive—based on next year’s expected earnings—than it was at the peak earlier this year and more expensive than at any point in the past five years.
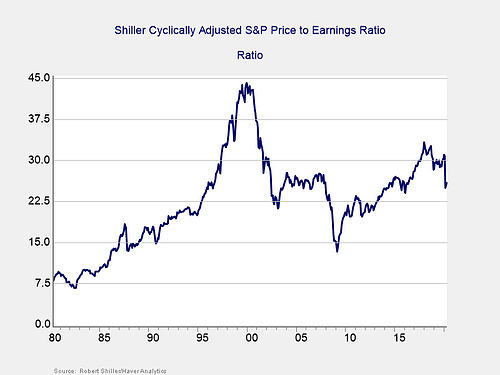
The Shiller ratio. While concerning, the problem here is that this analysis relies on earnings estimates, which can change and are certain to be wrong. To balance that shortcoming, we can also use a different metric that relies only on historical data: the average earnings over the past 10 years rather than estimates of the future. Because it uses averages over a 10-year period, this metric is less influenced by the business cycle or the abnormalities of any one year. It was popularized by economist Robert Shiller and is known as the Shiller ratio.
The chart below (as of the end of March 2020) shows that despite the sharp drop, valuations closed March at about the level of the peak before the financial crisis. As prices have recovered through April, that ratio has moved even higher. Just as the chart on forward earnings showed the market to be very expensive, this one shows the same based on historical data.
Stocks are not cheap. Between them, these charts tell us two things based on the fundamentals. From the first chart, even if earnings recover as analysts expect, the market is currently very expensive based on those expectations. For the market to outperform, earnings have to recover even faster. From the second chart, even if that recovery happens, the market still remains very richly priced based on history. In other words, whether you look at the past or the future, right now stocks are not cheap.
When will we return to “normal”?
That is the context we need to think about when we consider what is next. We will keep making progress on controlling the virus, but setbacks are likely at times. The economy will open and recover, but it might be slower than markets expect. This is the foundation of where we are right now.
The market, however, expects faster progress. Earnings growth is expected to resume in the first quarter of next year, which will require that the virus be under control, that the economy be open, and that consumers go out and spend money like they did in 2019. That expectation may be optimistic. In the best of all possible worlds, current prices make sense. In this world, we should expect more volatility.
Real and substantial progress has been made in both controlling the virus and supporting the economy until it opens again. We know what to do, we are doing it, and it is working. We will get back to something like normal—and likely in a shorter time than some fear. Still, we are not done yet, and there is still substantial progress that needs to be made before we can declare victory. The markets are very confident, and I hope they are right—but let’s not get ahead of ourselves.


