

 Print
Print Thus far, market momentum has carried over from 2023 into 2024. Things started slow, with the S&P 500 closing down more than 1.5 percent during the first week of the year. But it has since rebounded sharply, hitting several new all-time highs in the process and closing the month of January up 1.59 percent.
With that being said, let’s look at what a historically strong January can mean for the markets for the remainder of the year.
Strong January Returns
Since 1957, the S&P 500 has returned more than 1.5 percent during the month of January 33 times, excluding 2024—I’d consider that a pretty large sample size. More than 80 percent of those times saw a positive return over the next 11 months (February–December). Additionally, the median 11-month return for those 33 occurrences is 13.51 percent.
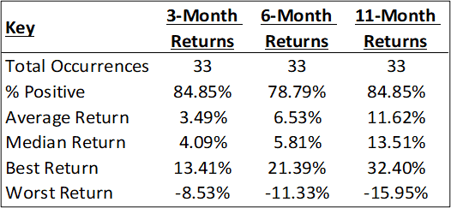
Source: Data from Tradingview. The table reflects index price returns excluding dividends. Past performance is no guarantee of future results.
But probabilities for a positive February aren’t as ideal, with just a little over 60 percent of these 33 occurrences having a positive February. Of these occurrences that produced a negative February, the average monthly return was –3 percent.
Another point worth adding is that 1.5 percent isn’t some number I selected to try to hide data that would make average returns look more attractive. Since 1957, the month of January has posted a positive return (>0 percent) 39 times, excluding 2024. Of those 39 occurrences, 33 (84.62 percent) posted a positive 11-month return, with a median return of 13.32 percent.
Back-to-Back Strong January Returns
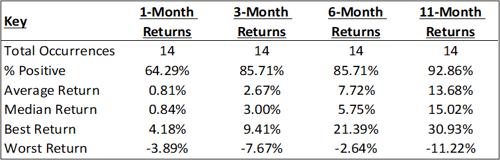
Not only has 2024’s January been strong, but 2023 also had a very strong January, seeing the S&P 500 post a 6.18 percent return during its first month. As we saw above, a strong January suggests that we’re on the right track for a positive rest of the year. But what about when the S&P 500 experiences back-to-back strong Januarys?
Since 1957, the S&P 500 has seen the month of January return more than 1.5 percent in back-to-back years 14 times, excluding 2024. A nearly perfect 13 out of 14 occurrences saw a positive return over the next 11 months. Additionally, 9 of those 14 times saw a double-digit 11-month return.
Source: Data from Tradingview. The table reflects index price returns excluding dividends. Past performance is no guarantee of future results.
As with our first example, you can see in the chart above that one-month returns (February’s return) tend to be a bit more volatile.
Election Year January Returns
The last January analysis I’ll present is when the month of January shows strength during a U.S. presidential election year. Since 1957, January has produced a return of more than 1.5 percent during eight election years, excluding 2024. Considering the returns our prior two examples have shown when January is strong, it should be no surprise when I say that all eight of those occurrences saw a positive return over the next 11 months.
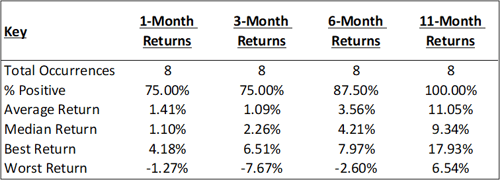
Source: Data from Tradingview. The table reflects index price returns excluding dividends. Past performance is no guarantee of future results.
2024 Outlook
Historical price returns are far from a guarantee of future price returns. Nonetheless, a strong January for the S&P 500 further increases my confidence that 2024 will be a strong year for the equity markets.


