

 Print
Print Today, I’d like to revisit a key point from my November blog post—the market’s run to end the year—and then cap it off with some historical election year data.
Here, we will be explicitly looking at historical S&P 500 data since 1957 or at data prior to 1957. Before 1957, the index as we know it today was called the S&P 90. In 1957, it was updated to 500 names that better reflected the market. If you’d like to learn more about the evolution of the S&P Index, check out this Reuters article on key dates and milestones in the S&P 500’s history.
S&P 500 and the 20 Percent Return
In my last post, I noted the quarterly returns and annual returns of the S&P 500, detailing how if the S&P 500 were able to close 2023 with a return greater than 20 percent, coupled with positive returns during Q1, Q2, and Q4, then it would paint a positive outlook for 2024. Well, following an 11.24 percent December for the S&P 500, the major stock index was able to finish the year over 20 percent.
There are three other instances (1975, 1985, and 1998) in S&P 500 history where the above returns occurred. In all three, the S&P 500 saw a double-digit return the following year.
Performance in the Last 10 Weeks of 2023
Over the last 10 weeks of 2023, the equity markets were significantly positive. During the final week of 2023, the S&P 500 hit a high of 4,793.3, which was a 16.8 percent move off the October 27 correctional bottom. Since 1950, that marks the second-greatest 10-week run to end the year (second only to the run in 1998). Further, since 1957, it is only the 14th time the S&P 500 has gone on a double-digit run over the last 10 weeks of the year.
When looking at the prior 13 years in which we saw a double-digit run to end the year, we notice a trend that has been a consistent theme throughout my blogs: Price action is much less certain over the short term, but positive probabilities may increase as you look further out.
Over the first three weeks of 2024, an analysis of the preceding 13 years reveals that 8 of those years experienced a negative return. But when you begin to look further out, we can see that 10 of those 13 years had a positive 12-week return to start the year, and 11 of those 13 years had a positive 52-week return. Below is a table detailing the average and median returns of the prior years.
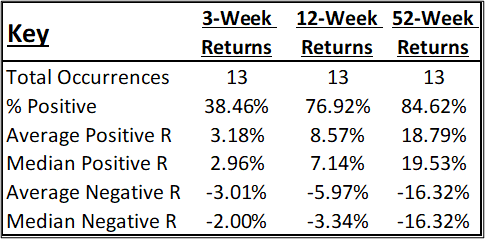
Source: Data from Tradingview. The table reflects index price returns excluding dividends. Past performance is no guarantee of future results.
Election Year Returns
Last but not least, let’s take a look at election year returns. A simple way to view election returns is to look at historical S&P 500 price data since 1926 (S&P 90’s introduction), with data since 1957 broken out. That gives us 24 election years since 1926 and 16 election years since 1957, with 75 percent of those 24 election years producing a positive return and 81 percent of those 16 election years producing a positive return.
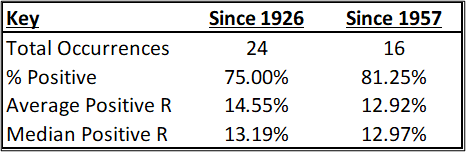
Source: Data from Tradingview. The table reflects index price returns excluding dividends. Past performance is no guarantee of future results.
Looking at election years since 1957 in more detail, we can note that Q1 returns have typically been the most volatile. Slightly less than half of the years saw a negative return, whereas more than 68 percent of each election year saw a positive return during Q2, Q3, and Q4.
A key theme for me has been analyzing historical returns when the S&P 500 annual return exceeds 20 percent. So, let’s look at every single election year since 1957 where the prior S&P 500 annual return was more than 20 percent. What we find is that all six of the instances saw a positive return, with an average annual return of 12.8 percent and a median return of 12.63 percent.
Of course, markets don’t move in a straight line, and we’ve already seen a slight pullback to start 2024. But as we have discussed previously, a healthy market experiences pullbacks along the way. With that said, and as you can see from the results below, January and Q1 have generally been the bumpiest periods. Half of the six years saw a negative return during January and Q1.
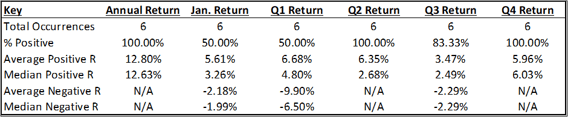
Source: Data from Tradingview. The table reflects index price returns excluding dividends. Past performance is no guarantee of future results.
What’s Ahead for 2024?
It is important to note that the analysis here is historical, and past results do not assure that patterns will continue into the future. But in my analysis of historical S&P 500 data and election year data, the past indicates to me that 2024 could be a strong year for the equity markets.


