 One of my colleagues sent around the most recent issue of The Economist, noting that the cover story, “Riding High: What Could Bring Down America’s Economy?”, may well be a contrarian indicator. I haven’t read the article yet, but I suspect the publication may be in on the irony here. Nonetheless, the fact that The Economist can put this story up could be a sign that the economy really is getting close to a turning point.
When a trend gets to a point where it is hitting major magazine covers, it is—as we say in the investing business—"priced in.” Everyone now knows about the trend. And as trends depend on continued growth, where will the growth come from when everyone knows about it? A magazine cover story can therefore mark the end of that trend and likely the start of the next one.
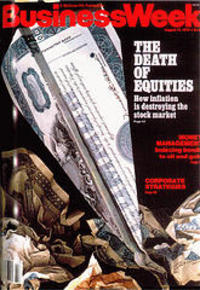
The most (in)famous example of that scenario is the 1979 cover of BusinessWeek. It proclaimed the death of the stock market—just before the multidecade bull market of the 1980s and 1990s kicked off. The cause of this death was rising inflation, and the arguments were (on their own terms) sound. The problem? When things changed and inflation was tamed, so did the conclusions. This cover came at a point of maximum pessimism, which had created the conditions for a change.

What do the headlines mean for investors?
We know that sustained market drawdowns typically occur along with economic recessions, which makes sense. If the economy keeps growing, we can have sharp pullbacks—1987 was the biggest and, most recently, 2018—but they tend to be short. The major, life-changing bear markets have happened with recessions. So, anything that can predict or rule out a recession is obviously a big deal. The Economist cover, if it is a contrarian sign, indicates that risks are rising.
As it happens, while the economy is still chugging along, the growth trends are weakening. In fact, we are now at a yellow light here at Commonwealth (see our most recent Economic Risk Factor Update). That slowing, however, has obviously not affected the stock market, which is trading at new all-time highs. Indeed, with the recent break through some key price levels (27,000 for the Dow Jones Industrial Average and 3,000 for the S&P 500), there is a real chance that the market melt-up will continue. This magazine cover reflects the kind of sentiment that can drive a melt-up.
Look beyond the headlines
The real takeaway from the magazine cover is that it can reflect sentiment that is entirely one way or the other. But the truth is always somewhere in-between. Right now, the economy looks like it will keep growing indefinitely—but it won’t. The market is reacting to multiple expected interest rate cuts, which will happen only if growth slows. So, we will get one or the other, but not both. All of the policy risks out there haven’t really kicked in yet—see the trade war—and the expectation is that they won’t. In other words, this week’s Economist cover story, whether ironic or not, reflects a widely held idea that everything will keep going right, and stock valuations reflect this assumption.
Bullish cover highlights rising risks
Things always look brightest at the peak, and there are signs that peak may be receding behind us. Consumer and business confidence are down, both of which have a high correlation with stock valuations. Earnings growth has slowed, even as valuations keep rising. Buybacks, one of the pillars of this bull market, are also pulling back. Although I think we have another couple of quarters to go, there is no doubt risks are rising.
And a bullish headline on a major magazine cover is just one more sign of those rising risks.


 Print
Print

