Print
PrintAlthough there was some good news last month—job growth bounced back to come in well above expectations—the overall trend remains negative. Confidence has continued to decline, while the yield curve hit an official inversion as of the end of June. That said, conditions remain generally favorable, with all metrics in expansionary territory except the yield curve, but there is no doubt the risk level has risen further. That risk still does not look immediate, but that point may be getting closer.
The Service Sector
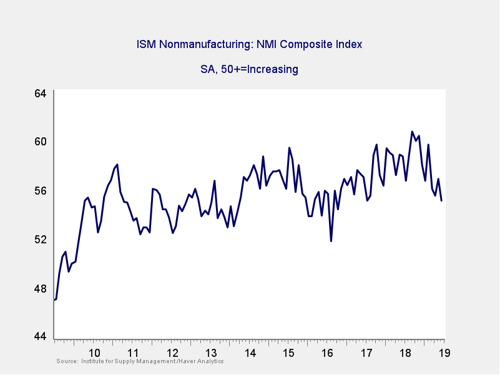
Signal: Yellow light
As a representative sample of the largest sector of business, this is an important leading indicator. It fell back again last month, taking it close to the lowest level in almost two years. In addition, the manufacturing index continues to weaken, which adds color to this reading. Although the risk level remains elevated as these indices decline, conditions remain expansionary, at least for the moment. As such, we are keeping this indicator at a yellow light.
Private Employment: Annual Change
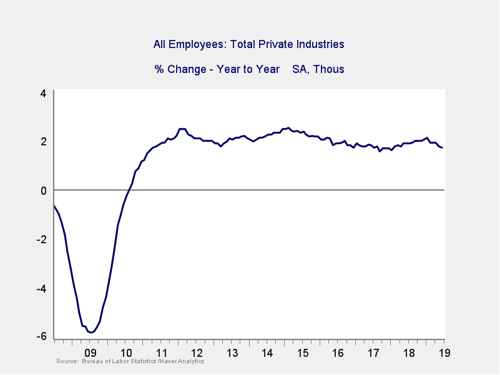
Signal: Green light
With a significant recovery in June job growth, private employment growth stabilized on a year-on-year basis. Although it remains at healthy levels (at or above those of the mid-2000s), the growth rate has declined consistently so far in 2019, suggesting that the decline in the growth rate is now an established trend. If this trend holds, it will eventually take us to a risk level—but we are not there yet. Because this is an annual figure, the changes are slower and smaller than those we see in more frequently reported data.
Private Employment: Monthly Change
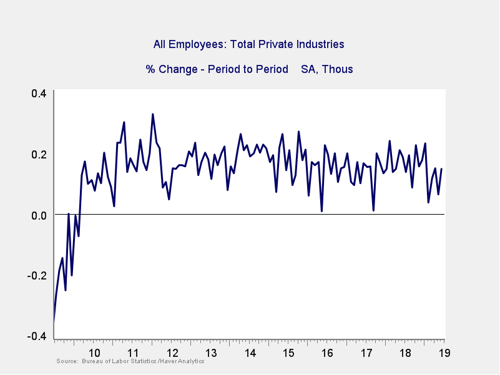
Signal: Yellow light
These are the same numbers as in the previous chart but on a month-to-month basis, which can provide a better short-term signal.
After a weak May, June’s job creation bounced back, suggesting that growth continues despite a couple of weak months this year. That said, the monthly results have been meaningfully weaker in 2019 than in previous years, which provides further evidence that growth is slowing. The volatility of the monthly results, along with more frequent weakness, is an indicator that job growth may be weakening. As such, I am keeping this indicator at a yellow light.
Yield Curve (10-Year Minus 3-Month Treasury Rates)
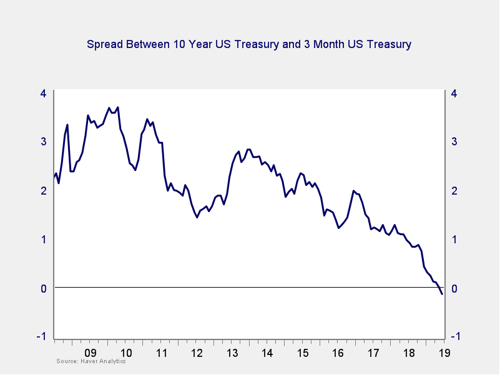
Signal: Yellow light (tending to red)
Rates closed last month at the first full inversion since before the financial crisis, which historically has been a sign of a pending recession sometime in the next couple of years. This indicator has, however, generated false signals in the past and is not infallible. Given that, and the likely lag before a recession, we are keeping this indicator at yellow shading to red for the moment. Although an inversion is a good signal of pending risk, the better signal for immediate concern has been when the curve un-inverts, typically due to rate cuts, and that will likely be the point at which we take this indicator to a full red.
Consumer Confidence: Annual Change
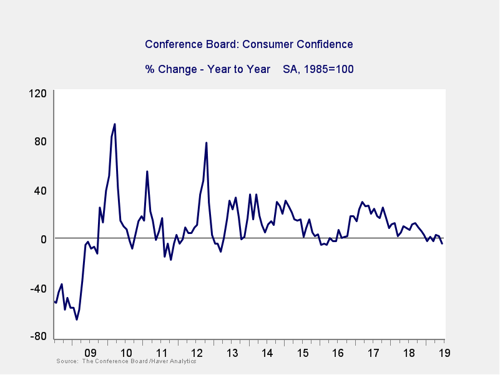
Signal: Yellow light
Confidence dropped again in June, taking it further away from recent highs and moving the year-on-year change meaningfully below the zero level. Although it remains above problematic levels, it is getting close, and another bad month could conceivably get us there. The absolute level of confidence remains high by historical standards, but the annual change suggests that risks continue to rise. As such, we are leaving it at a yellow light.
Conclusion: Risk remains elevated
Despite a recovery in job growth, signs of weakness continue to multiply. Both consumer and business confidence were down meaningfully, and the inversion of the yield curve is now official. These results suggest that although current conditions remain favorable, risks are increasing. The risk factors remain outside of the red zone, but some are getting quite close.
Although a continued slowdown remains the most likely case based on the data, a slowdown is not a recession—we likely still have several quarters to go there. Nonetheless, the bulk of the data indicates the risks of a worsening slowdown remain material (again, not yet as the base case). As such, I am leaving the overall risk level at a yellow light for the economy as a whole for July.