 Early last year, I made a rather bold statement: the employment boom was on. I had been hinting at it well before that, but in April, I finally felt that I could make a good case. Now, more than a year later, concerns about the economy are rising. So, is the employment boom still on?
Job creation strong but slowing
To help answer this question, let’s start with the two most inclusive employment surveys: the establishment (business) survey, which is the light blue line in the chart below, and the household (personal) survey, which is the dark blue line.
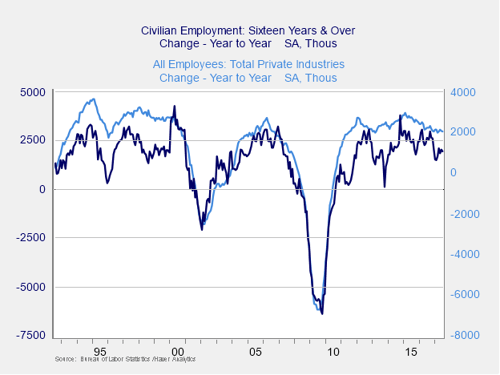
When comparing the current results to those of the late 1990s, a couple of interesting points emerge. First, the numbers are still reasonably strong. Specifically, the household numbers are very close to 1990s levels, and the business numbers are close but somewhat worse. Second, both surveys show job growth has been running at about the fastest rate that we’ve seen since the mid-2000s. In terms of job creation, if the late 1990s were a boom, we are at least close. If the mid-2000s were a boom? We're already there. Note also that this trend has been going on for five years, compared to the two years in the 2000s. Pretty good!
That being said, recently, there has been a drop-off in both measures. Is this a sign of trouble? It certainly could be, but let’s dig a little deeper.
Why is hiring down?
There are two possible reasons why hiring might be slowing. It could be a drop in demand, as companies don’t need the workers. Or it could be due to a drop in supply, as everyone gets hired. The evidence suggests it is likely the latter. We are simply running out of workers.
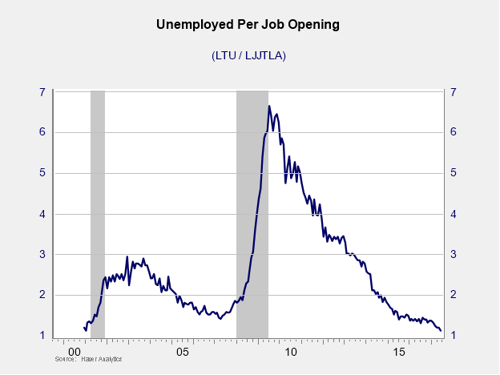
Taking the number of open jobs and dividing by the number of unemployed people, we find that the ratio has dropped down to 1.13, which is close to the lowest level ever. This means there are just about as many jobs as there are people looking for them. Given the inefficiencies in the labor market—mismatches of skills, locations, and so forth—employers, in many cases, simply can’t find good candidates to hire.
Layoffs still low
Another way to assess job market strength is to determine whether employers are laying off employees. This is consistent with the previous analysis, as employers that can’t find new workers are much less likely to let go of existing workers. If we look at the number of people filing for unemployment, we can see that this figure is at an all-time low.
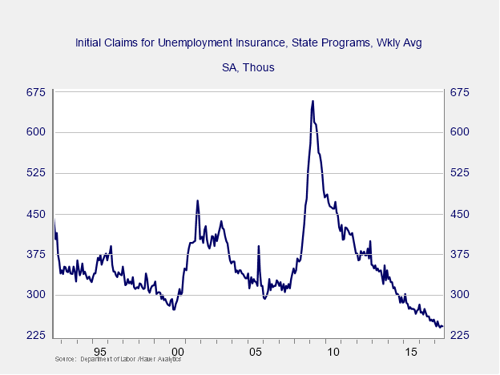
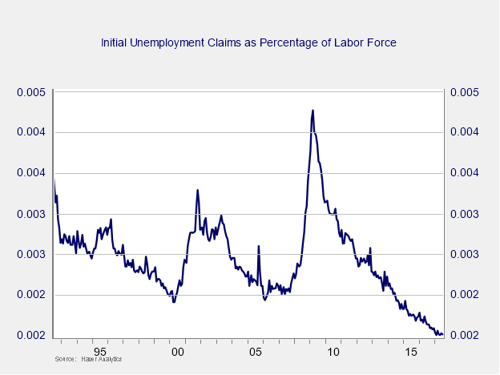
But keep in mind that the number of workers today is much larger than it was in the 1990s or 2000s, so the reduction in layoffs is even more striking than at first glance. If we examine unemployment claims as a percentage of the employed workforce, it’s clear that we are doing even better than in the 1990s. Overall, then, the reduction in hiring is more likely due to a lack of workers than to companies not wanting to hire.
Poor wage growth . . . or is it?
Another way to gauge the health of the job market is to consider wage growth. Recent wage growth has been disappointing. A recent decline, illustrated in the chart below, is a real concern.
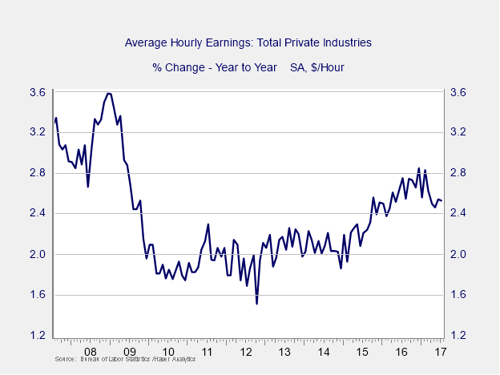
On an hourly basis, wage growth was recovering strongly until about the start of 2017, only to drop back again. But there are real questions as to why that is. One component might well be the slowdown in hiring, meaning wage growth that comes from new hires is below what it might otherwise be.
If that is the case, one possible outcome is that companies are working their existing staff for more hours, rather than hiring new (and more highly paid) employees. To evaluate this scenario, let's consider weekly income, which includes both hourly wage growth and changes in hours worked.
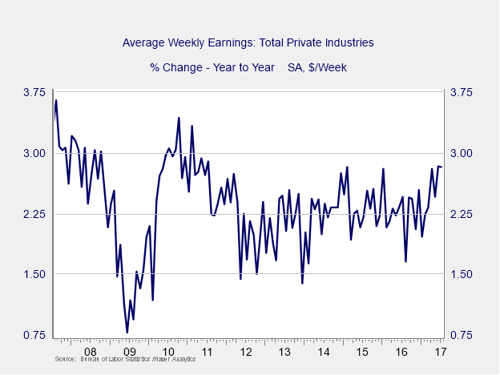
Unlike hourly wages, where growth increased in 2015 and 2016 and then pulled back in 2017, weekly income growth was generally level in 2015 and 2016. It then moved up in 2017 to one of the highest levels since the crisis. This is entirely consistent with the idea that while wages are not rising, companies are giving more hours; therefore, weekly income is rising faster than hourly wages. It is also consistent with the idea that workers are staying put—rather than being laid off—and not getting wage increases from changing jobs.
Here’s the bottom line: even as wage growth has pulled back, wage income continues to rise at an accelerating rate. For the average worker, what matters is take-home pay, and this is doing much better than commonly reported.
The boom continues?
Job growth continues to be strong, although it is constrained by a lack of workers. Layoffs are at extreme lows, as companies try their best to keep the workers they have. And even income growth shows signs of acceleration. Given all of this, it seems clear to me that the boom continues. There are risks out there, to be sure, but the signs remain good—at least for the moment.


 Print
Print

