

 Print
Print Recently, I've fielded a few calls from advisors asking for my thoughts on media coverage declaring that current market conditions are similar to those of the late 1990s. Their clients are worried about what might happen. Could we see a replay of 2000?
I have a great deal of sympathy for the worry. In fact, I first brought up the 1998 comparison back in 2016. At the time, I pointed out that if 2016 were 1998, we could see a serious market pullback in 2018. But—since I have been doing this for some time—I added that this pullback scenario would occur unless something happened. Of course, something did happen: the tax cuts and expanded government spending, which have bought us another year or so of expansion. That stimulus seems to be playing out, though. Once again, the conditions do look a great deal like 1998. As such, let’s see what our big four economic indicators can tell us.
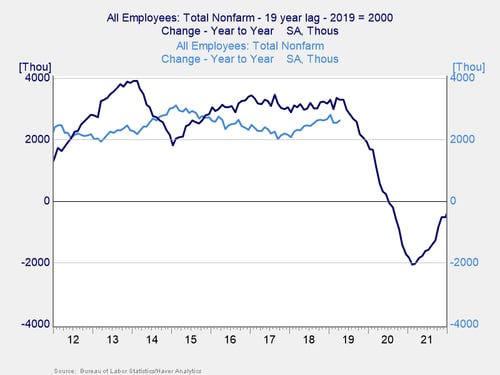
Job growth
If we look at a 10-year window, job growth has been steady—like that of the 1990s. If the comparison holds, however, we could see it drop sharply in late 2019.
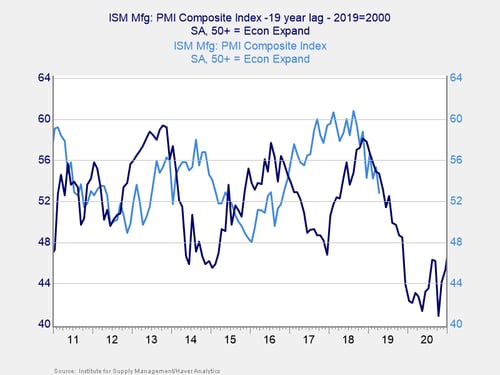
Service sector
Here, the comparison also holds, although I had to use the manufacturing index (rather than the nonmanufacturing index) due to a lack of earlier data. This index has outperformed the 1990s over the past 10 years, but it is now showing a decline that looks quite a bit like that of 2000.
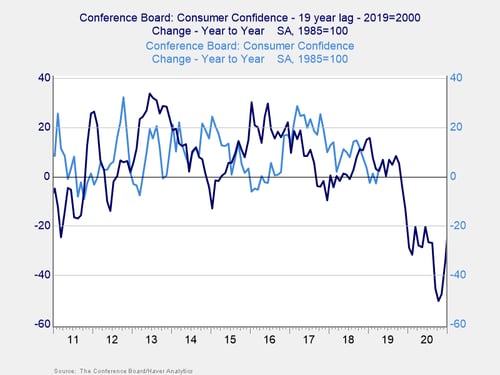
Consumer confidence
Changes in consumer confidence show the same trend. Again, there is considerable overlap between the late 1990s and now.
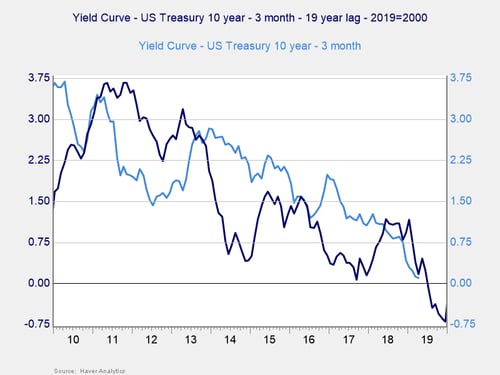
Yield curve
Finally, with the yield curve, the story is much the same.
All of our indicators tell us that 1998 all over again—or 1999, for that matter—is a real possibility. We could well be on the verge of another 2000.
Remember 2016?
Yet, you could (and I did) say the same thing three years ago. Back in 2016, we had a similar backdrop of rising trade and political tensions, along with slowing growth and a slumping stock market. At the time, there were real concerns that the expansion ended right there. Now looks a lot like then.
In fact, there are reasons to be even more concerned now. We have had brief inversions of the yield curve, although they don’t yet show on monthly charts (as you can see above). We have had pullbacks in several key economic metrics. Plus, the stock market is pulling back again. Risk levels are clearly rising.
The big picture, though, remains surprisingly positive. Hiring continues to be strong, and consumer confidence has bounced back up. Although business sentiment is down, it remains expansionary. And even if we do see a yield curve inversion, there is usually a lag of a year or more before an actual recession.
Will we have a recession?
Stock market pullbacks are typically brief without a recession, and the signs say no recession any time soon. We have never had a recession with job growth where it is. We have never had a recession when consumer confidence is this high, both on an absolute level and compared with a year ago. We have never had a recession with business confidence where it is. And we have never had a recession without an initial yield curve inversion. So, will we have a recession? At some point, certainly. But right now we are at a yellow light, not a red one.
We also must remember what I closed with in 2016: things look worrying unless something positive happens—and it could. The most likely candidate right now is an infrastructure spending deal, which could still be in the cards. Other possibilities include an acceleration of wage growth, which could juice consumer spending, or a Chinese trade deal coupled with significant stimulus. The economy and markets got a lifeline then and might well again.
Keep your eyes on the data
1998 all over again? Could be. But even if it is, we have another year or more before an actual recession, and we could get even more time. So let’s keep an eye on the data to see when potential risk starts looking more immediate.


