

 Print
Print After I posted my piece on diversification last week, my colleagues Peter Essele and Anu Gaggar reminded me that they had done a study of some of the trends behind that post. Their analysis highlights a couple detailed examples of what I was talking about. This may be a more technical read, but the conclusions are compelling. Great job, guys! Over to Peter and Anu.
Let’s return to the latter days of 2015, when many financial advisors and investors decided to remove exposures to international and emerging markets. This move was largely driven by the fact that domestic markets had handily outperformed emerging and international markets over the prior three years. The hope was that they'd continue to do so, particularly in light of uncertainty abroad.
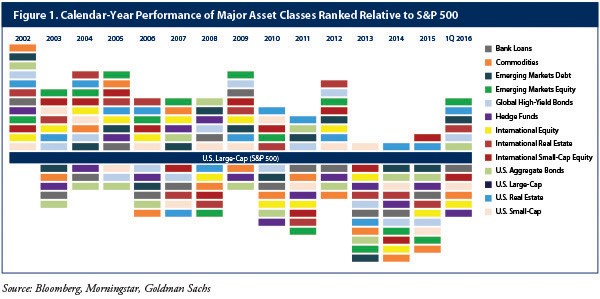
As you can see, over the prior three calendar years for the period ending December 31, 2015, domestic equities clearly outshone all other major asset classes held by the average investor. Given that, did global diversification make sense?
Investors may be regretting EM exodus
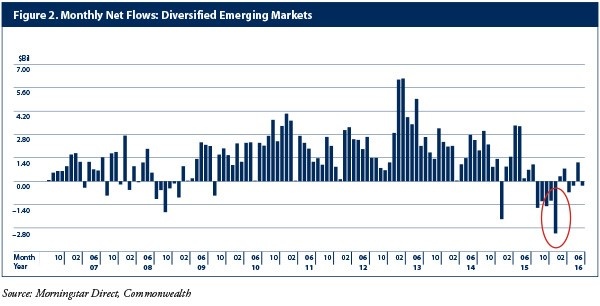
The market’s answer was a mass exodus from the emerging markets asset class on a magnitude never seen before, including during the 2008 downturn. In December 2015, $3.1 billion moved out of Morningstar’s emerging markets category, as shown below. The market had clearly made up its mind, preferring portfolios with reduced emerging markets exposure, if any at all.
Now, almost 10 months into the year, we can see that those decisions were ill timed, as the MSCI Emerging Markets Index has outpaced the Russell 3000 by almost 10 percent. On closer inspection, investors will find that the MSCI Brazil and MSCI Russia indices (representing two of the four BRIC countries) are up 71.81 percent and 32.55 percent, respectively, over the same time period!
To put those numbers in perspective, at a 5-percent allocation and 16-percent year-to-date return, emerging markets would have contributed roughly 80 basis points in the first 10 months of 2016. That’s a powerful punch from such a small allocation, and it’s quite feasible that many of the investors who shed the asset class in December 2015 and the early days of 2016 missed out on the boost from this historically small strategic allocation.
EMD asset class makes a comeback
A similar picture emerges when we look at emerging market debt. Following three years of outflows that began with the “taper tantrum," the asset class has seen an uptick in interest of late, as yield-starved investors search for attractive income outside of core fixed income asset classes.
The chart on the right below provides a granular breakdown of year-to-date flows into emerging market debt. Most EMD papers have seen positive flows after a subdued start to the year. Accommodative central banks in the developed world, a rebound in commodity prices, and expectations that the U.S. will remain in a “lower for longer” cycle have led to this resurgence.
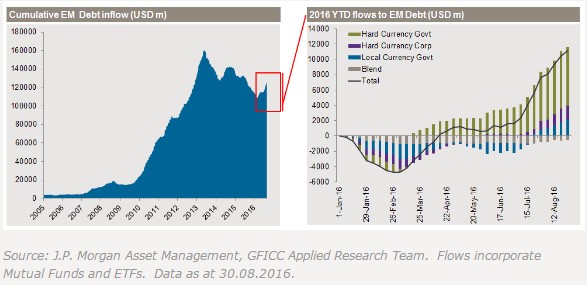
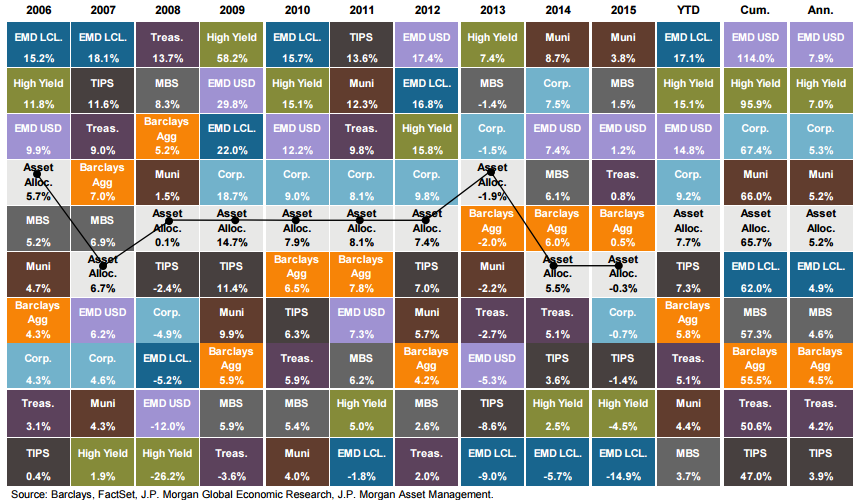
Not surprisingly, this seems to be more of a momentum or beta trade, with flows following performance. Local-currency emerging market debt has seen quite a rebound this year, moving from a bottom-performing asset class to a top-performing one. There will come a time, of course, when the beta trade runs its course and investors start looking for alpha. And that’s when we will be able to filter through the noise and see how investors’ long-term asset allocations have moved.
Trend toward passive EMD investing
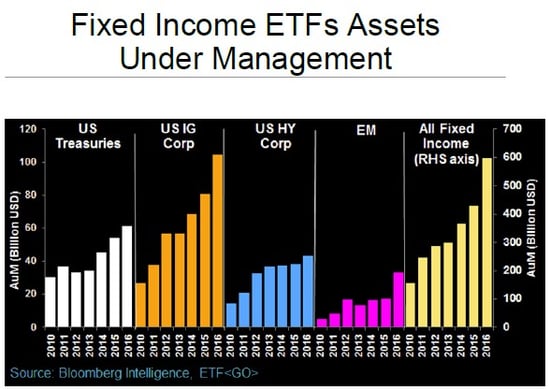
Another trend is a growing appreciation for passive investing in emerging market debt, either as a replacement for or a complement to actively managed strategies. Emerging market debt has attracted more than $14 billion in ETF flows so far this year, accounting for about 40 percent of total ETF asset flows year-to-date.
Five years back, emerging market debt was an insignificant asset class, and even today, it represents a very small portion of the world of fixed income securities. These investments have been growing at a very fast clip, however, with ETFs capturing a big chunk of the inflows. EM fixed income ETFs have grown from $1 billion to $33 billion in assets in just five years. As of the end of July 2016, ETFs held 23 percent of emerging market debt assets under management.
Performance-driven flows have resulted in a tightening of spreads and yield compression. The emerging market debt category has experienced a decline in yield of almost 2 percent since February, while prices on bonds have soared. In Commonwealth’s Preferred Portfolio Services® Select models, we harvested some gains and reduced our dedicated emerging market debt exposure, as we felt that the risk/reward equation was no longer as attractive.
Brad again. Looking at the past, we can see a connection between investor actions and performance. When investors are moving away, typically after a period of underperformance, it often heralds the right time to buy. Similarly, when investors are chasing an asset class, it may be time to sell. Diversification forces you to do just that as you rebalance, to the probable benefit of your portfolio. This is exactly what we try to do here at Commonwealth in our internal portfolios, for precisely the reasons Peter and Anu describe.


