

 Print
Print Yesterday, we discussed business confidence and concluded that it is better than the headlines suggest. Today, we are going to look at the even more important level of consumer confidence—and whether it may be considerably weaker than it appears.
The headline number
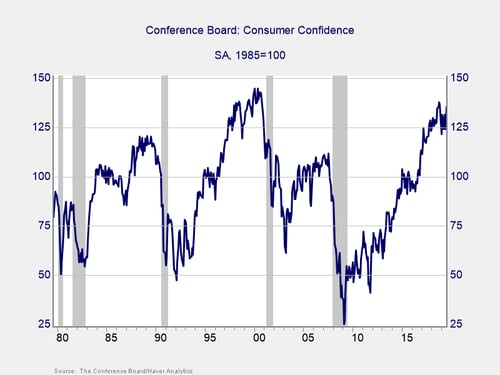
You wouldn’t get any sense of weakness from the headline number. As the chart below shows, confidence is close to the highest levels since 2000 and close to all-time highs. On the face of it, confidence is about as good as it gets. But when you look into the details? That great number is actually fragile.
Present versus future expectations
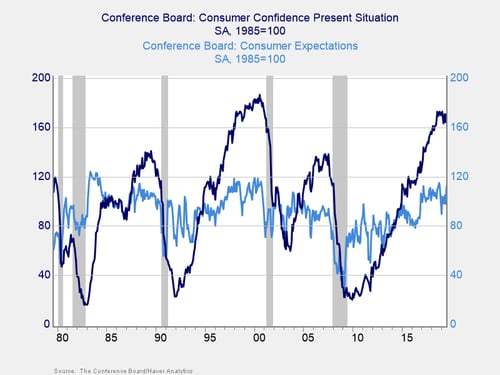
Breaking down the survey, there are actually two questions to ask. The first is, how do you feel about the present situation? Here, the news is great—at or close to the highest level since 2000. The other question, however, relates to expectations or how you expect to feel in six months. Here, we see much lower confidence. Not terrible, certainly, but clearly people don’t expect the future to be as good as it is right now.
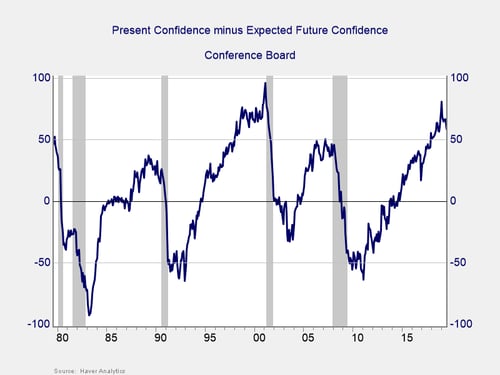
That gap, between present and future (as shown in the chart below), is also close to all-time highs. The larger the gap, the greater the magnitude of the potential confidence decline. Also, the larger the gap, the greater the chance the drop will be fast (see 1989, 2000, and 2009). Right now, there are initial signs that we might be seeing that drop and that it could be 50 points or more in a relatively short time.
Why does it matter?
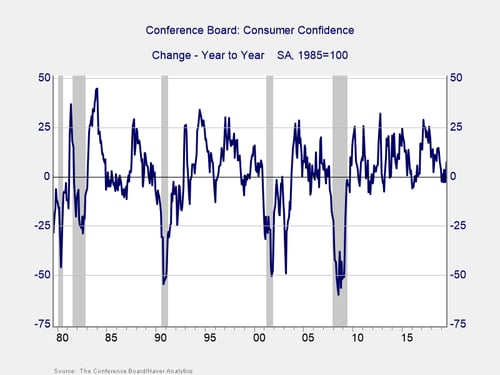
The reason that drop matters is that when consumer confidence falls by 20 points or more, year-on-year, we typically have a recession (as shown in the chart below). If current confidence levels drop close to expectations, then that will take this indicator well into the risk zone. With consumer spending making up more than two-thirds of the economy, that decline could be what ends this expansion.
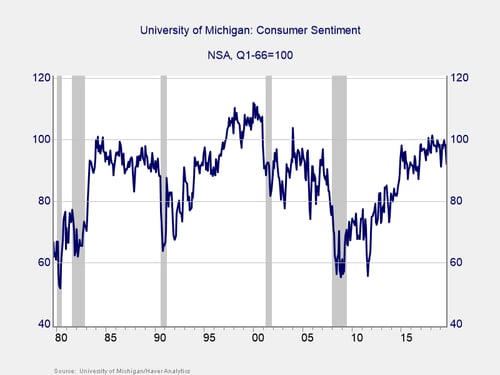
University of Michigan survey
So, the Conference Board survey is strong yet fragile. But another survey suggests that confidence might already have started to decline. The University of Michigan survey, shown below, never got as positive. In the past couple of years, it has shown much more of a tendency to decline—especially in recent months.
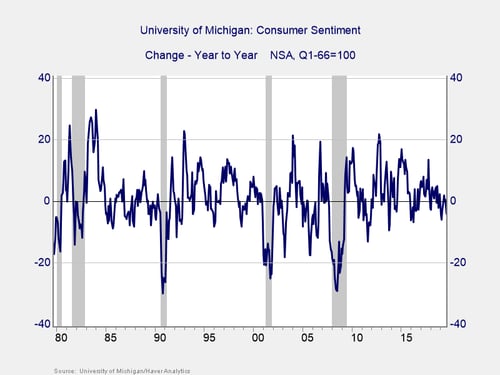
Looking at the year-on-year trend in this survey, we see similar weakness, with the change below zero over the past year and with the trouble zone around –15. This indicator is showing weaker performance and more risk.
Consumer confidence more fragile than it looks
Is there any recent evidence we could see such a fast decline? There is. In January of this year, the government shutdown took down the Conference Board’s consumer confidence measure by almost 15 points in two months. Since then, we have seen two months with 7-point swings in confidence based on trade war headlines. Although all have bounced back, the potential for a large, sustained decline—one large enough to derail the recovery—is real. Headlines, therefore, are certainly worth watching because of their potential to hit confidence. But it is the effect itself we need to pay attention to. As we have seen, it can be real but fleeting.
Right now, confidence remains solid, which has supported consumer spending growth and the economy as a whole. That should continue, absent more bad news. If we do get more bad news, though, there is evidence that confidence is more fragile than it looks and that it can be shaken by the headlines. That is why I am watching consumer confidence closely.


