When I look at the current economic and market environment, I think it shares a lot in common with 1999. The tech industry is booming, unemployment is low, consumer and business confidence are high, and investors are very complacent. But just how similar are 1999 and 2017? To get a better sense, I decided to do a detailed economic review. So, without further ado, let’s set the wayback machine to 1999.
How do the economic indicators compare?
The best way to compare 1999 and 2017 is to look not only at the levels of various economic indicators, but also at how they got to those levels. Here are the four I consider most important.
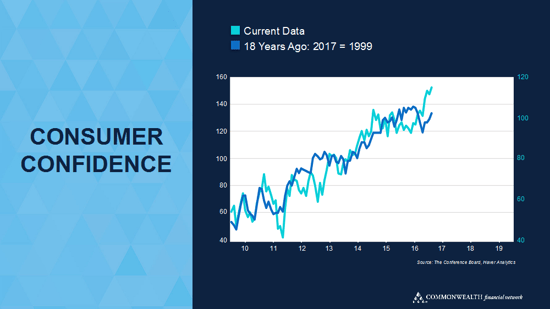
Consumer confidence is very high right now. Not as high as it was in 1999, to be sure, but the path up looks similar. After several years of positive developments, people are feeling good, and they’re ready to act on it.
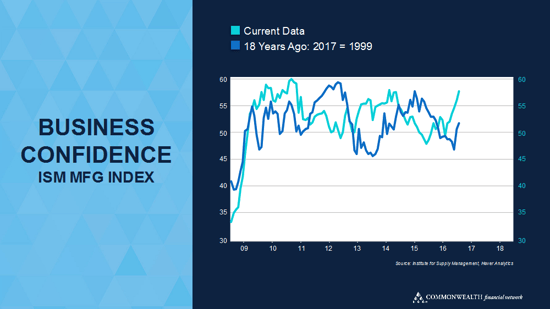
The same applies for business confidence, except here confidence is even higher now than it was in 1999. I used the ISM Manufacturing survey here, as the non-manufacturing one does not go back far enough.
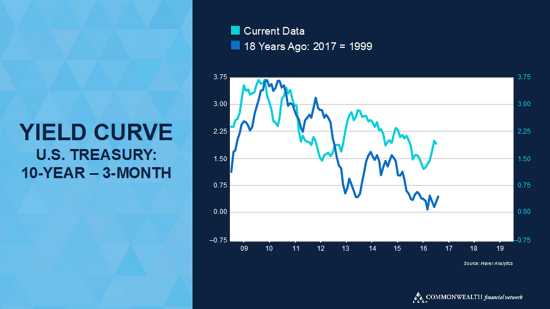
Looking at the yield curve, we can see that the Fed is providing more monetary stimulus now than it did in 1999. As the Fed continues to pull back—including today’s likely rate hike—that means the economy might be even more inflated by monetary policy now than it was then.
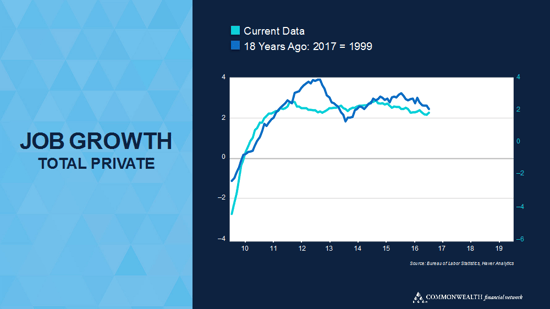
Most important, we can see that job growth has closely tracked levels of the 1990s over the past several years. We did not get the early bump to quite the same degree, but the current growth pattern—and the slow decline in growth—looks much like the late 1990s.
Overall, the economic facts on the ground make 1999 and 2017 look quite similar. It is not just the 1990s, of course—any period of growth will follow a pattern like this. Still, from an economic point of view, 1999 and 2017 do indeed bear more than a passing resemblance.
What about the markets?
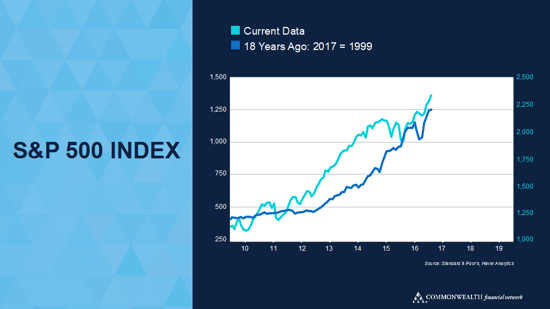
We can see from the chart above that the markets have responded to all of these factors in, again, very much the same way they did in the 1990s. Stocks have done very well indeed over the past several years. And since the election, we’ve seen something of a melt-up. In fact, late last year, we hit a market milestone: all the major U.S. stock indices hit record highs—something we hadn’t seen since December 31, 1999.

Of course, differences do exist. Some things are better today, some things are worse, and with some things, it’s tough to tell. Nonetheless, from a big-picture perspective, the comparison to 1999 holds up remarkably well.
Now, 1999 was a good year, just as 2017 is shaping up to be a good year. With the wisdom of hindsight, though, we know that even as things were great, the seeds of the next downturn were already growing. What we really need to know is not what the comparison tells us about today, but what it means for us in the future. We will look at that tomorrow.


 Print
Print

