

 Print
Print Over the past two days, we have looked at the signs that a recession is coming, going so far as trying to time it to the middle of next year. What we haven’t done is look at perhaps the most important question: how bad will the recession be when it hits? After all, the timing may not matter that much, but whether it’s going to be mild or severe certainly makes a difference.
Another Great Recession?
The fear that haunts pretty much everyone is that the next recession will be like the last one. Given how bad the last one was, this is a very reasonable worry. If we did get another Great Recession, it would rock the real economy around the world, devastate financial markets again, and likely derail many people’s planned retirements. We need to know if a big storm like that is coming.
Fortunately, the signs are saying the next one will be an ordinary recession, that is, one that slows but does not destroy the economy. 2008 was called the Great Recession for a reason. Back then, a conjunction of factors took an ordinary recession and combined it with a banking crisis—which turned it into something far worse. This time, we can expect the ordinary recession, but the imbalances that created the financial crisis simply are not there. Banks here in the U.S. are much more financially stable, and the debt burden for consumers is much lighter.
What does an ordinary recession look like?
So, what does an ordinary recession look like? As you can see in the chart below, over the past 30 years, the recessions in the early 1990s and early 2000s bottomed out with economic growth at around zero on a year-on-year basis—which is significantly better than the 2008 downturn. Remember, too, that the 1991 recession had a financial crisis of its own, as the savings and loan industry collapsed, and the damage was still much milder than in 2008. We could and likely will have some stress on the system, but that stress is not likely to result in another 2008.
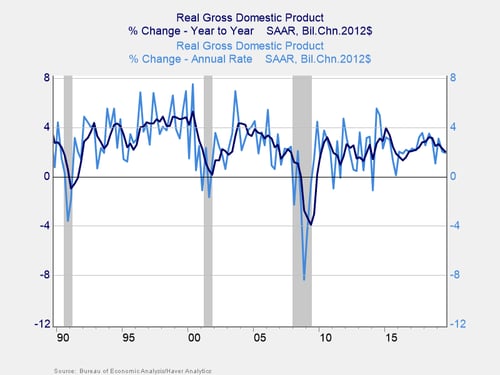
Also note the difference between the light blue line (i.e., the quarterly changes in GDP) and the year-on-year numbers. The quarterly numbers bounce around a lot more, but what matters in the real world is the year-on-year change. And when you look at that change? The volatility is less—as would be the damage.
If we get an ordinary recession, based on 1990 and 2000, growth would be very unlikely to go much below flat on a year-to-year basis at any point. High employment levels and wages should keep consumer spending (at two-thirds of the economy) healthy, while business spending is already flat. Government spending growth should act as a cushion. In other words, a recession would simply be more of a deeper slowdown than a collapse. This scenario is what we saw in the recessions of 1990 and 2000, and current conditions are much more like they were then than in 2008. The best comparison, the 2000 recession, was not fun—but nor was it a crisis like 2008.
A market perspective
From a market perspective, we can draw the same conclusion. With interest rates low, stock market valuations have moved higher over the past several years. The lowest price-to-earnings ratios in the past five years were in 2015, at 13x forward earnings. The lowest ratios in the past couple of years were at the end of 2018, at 14x. If the S&P 500 collapsed to the 13x multiple, it would go to around 2,550, for a decline of about 18 percent. This drop would be considerably better than what we saw in 2000, or 2008, and consistent with other declines we have already seen in the past couple of years. Even if earnings were to drop, or valuations drop even further, we can still conclude that conditions in a recession would not be nearly as bad as in 2008 or, for that matter, in 2000.
The real takeaway
A recession is becoming increasingly likely, but it is not at all certain. If we do get a recession, however, it is unlikely to be like 2008, but more like 2000 or even 1990—neither of which was nearly as severe. Even on the market side, there are good reasons to believe any drawdown would also not be as severe as in the last two recessions.
No one wants to see a recession come. But come it will, at some point. It is a good idea to think through what that might mean ahead of time, as we have just done. Fortunately, the news is better than might be expected.


