

 Print
Print We closed yesterday’s post on the stock market and your portfolio with the proposition that future returns, historically, have been lower when the market started out expensive than when the market started out cheap. This would seem to be common sense, but there is considerable resistance to the idea. Let’s think it through by starting with a look at the actual numbers.
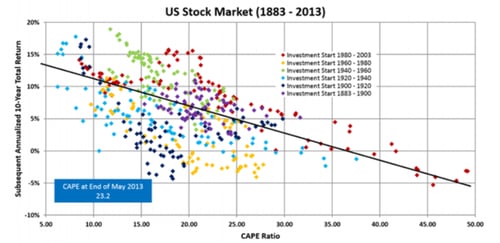
There are many sources for this kind of data, but the chart above is a good presentation (although a couple of years old). If you’re interested, the original can be found on the Seeking Alpha website. The vertical axis is the annual return over the next 10 years. The horizontal axis is how expensive the market was using a cyclically adjusted price/earnings (P/E) ratio—better known as the Shiller ratio. More expensive markets are to the right.
You can see quite clearly that, although there is a lot of noise, in general returns drop the more expensive your starting point. This applies for all periods. Right now, per Robert Shiller himself, the Shiller P/E is at 31.19, putting likely returns over the next 10 years at somewhere between about –2 percent and 7 percent per year. Now, compare those returns with returns for the S&P 500 of about 10 percent since 1928 and about 13 percent from 2009 through 2017. Based on history, then, the best case is that returns will be about one-third lower than the historical average and about half of the recent experience. That’s a big gap, and one that many investors don’t realize exists.
Earnings growth and valuations
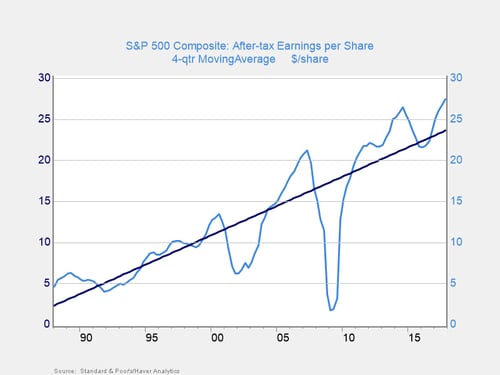
Why is this? The reason is math. Stock values come from two factors: earnings growth and changes in valuation levels. Earnings growth varies over time. But generally, as we can see in the chart below, there is a pretty smooth upward trend over time, although certainly variable in the short term. If valuations were constant, then stock prices would vary along with earnings. This would still give us a lot of volatility—but not as much as we actually see.
Valuations are the other factor that comes into play (i.e., how much investors are willing to pay for a given level of earnings). Valuations are expressed as a ratio of the price to the earnings; if investors are paying $10 for $1 of earnings, then the P/E ratio is 10. Depending on how confident they are, that price (the P/E) can vary significantly. Note, however, that in every case, the base $1 of earnings is the same.
What’s the math?
If you have a P/E of 10, you are paying $10 for $1 of earnings. So, in theory—if you owned the whole company—you would get a return of 10 percent. Similarly, at a P/E of 20, you would get a return of 5 percent. This is why returns tend to be lower at higher prices/valuations. There is simply, mathematically, less earnings to pay investors. Again, if valuations were constant, the return to stocks would simply be the change in earnings, which is lower the higher the initial price.
It’s not that simple
Valuations vary over time, typically as investors get more or less excited about future growth. Recent peaks, in 2000 and 2007, were based on widespread optimism that growth was unlimited, first for tech stocks and then for housing. That optimism led to strong market performance, as investors benefited from both earnings growth and rising valuations. After a while, however, the rosy expectations didn’t play out, leaving investors less confident and pulling valuations down. This hit the market with a double whammy, by paying less for lower earnings and driving returns down dramatically in the aftermath.
A look ahead
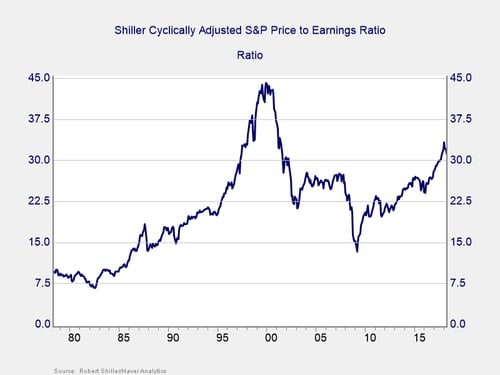
Looking at current valuations, per the chart below, we are well above all levels except for the dot-com boom. Since 2009, strong returns have benefited from both earnings growth and rising valuations. Looking forward from now, however, one of two things has to happen: (1) All of the existing optimism will pay off and growth rates will permanently increase, driving valuations up even further; or (2) valuations will adjust down.
Could things be different this time?
Increasing growth rates could happen for a while. Mathematically and economically, though, corporate earnings are already a very large part of the economy. For the first to be true, they would have to increase significantly more, to a level we have never seen before. Plus, things really would have to be different this time—in economics, politics, and business. But this is not a new story. We saw this in 1999–2000, in 2006–2007, and at many other times. We have seen this movie before, but everyone always thinks the ending will be different this time.
I think the ending will be the same. I am also betting on the second possibility—that valuations adjust down, which is consistent with history, logic, and common sense. That will result in lower returns over the next 10 years, again per history. Just as with bonds, we need to take that into account when we plan our portfolios.


