

 Print
Print We closed yesterday’s post on market turbulence with the big picture: risks are rising, but they are still not necessarily immediate. Of course, this is important to remember. But it also implicitly assumes that, as investors, we are primarily concerned with that short-term risk. In fact, what we should be looking at is how our portfolios are likely to play out over years and decades, not the next couple of quarters. With that in mind, what can we discern from current conditions about the longer-term impact?
We know a couple of things about the markets right now. Interest rates, while rising, are still very low by historical standards, and bond yields are proportionately low. As an almost direct corollary to that, stock prices are quite high by historical standards. Both have some cautionary tales about likely returns over the next 10 years.
Bonds: Where are we going?
When you buy a bond, generally speaking, you get the coupon payments and then get your money back. In theory, the return you get is locked in on the day you buy the bond—absent changes in the market. Over the past 30 years, though, as interest rates dropped, bonds with higher coupons became more valuable. As such, the total return to a bond would be more than the coupon payments. Lower rates meant capital appreciation for bonds (they were worth more), and investors could buy a bond, collect the coupon payments for a while, and then sell it for as much or more than they paid. Good times!
Bonds as an asset class have done very well over the past couple of decades, for just that reason. High coupon payments and capital appreciation were a great combination.
Now, however, that process is possibly headed into reverse. Rather than high initial coupon payments, we now have low coupon rates. Rather than dropping rates and capital appreciation, we now have the possibility of rising rates and capital depreciation. Rather than high coupons plus a bonus, we will now likely see lower coupons minus a penalty. This is a very different environment—and one that follows unavoidably from where we are right now. Looking forward, the most probable case for bonds is that you get a return of the coupon rate, which will be much lower than the average over the past 30 years. Higher prices mean, mathematically, lower forward returns.
What about the stock market?
The same logic applies to the stock market, except here the metric is not coupon payments but earnings. To make things more complicated, earnings can also grow over time. If earnings are growing faster, you might be willing to pay more, knowing that over time the price will not look as expensive based on those higher future earnings.
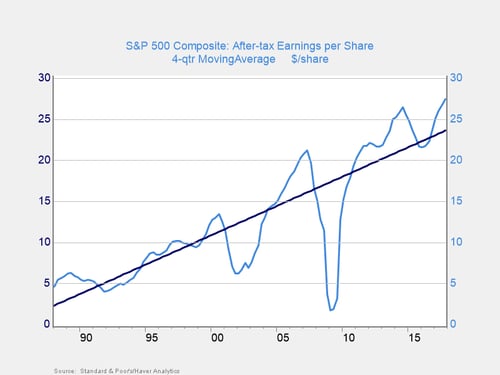
The thing is, future earnings grow at roughly the same rate over time. Boom times are succeeded by bad times. Overall, however, the growth rate is reasonably constant. In the above chart, you can see that current earnings growth is now well above the trend line. Note also that the only two times we've seen this in the past 30 years are in 1999–2000 and 2006–2007, both times of previous stock market booms. If you then overlay stock market valuations (i.e., how much investors are willing to pay for stocks overall), you also see that they are willing to pay the highest prices when earnings growth is highest. That makes sense, as investors are confident when their companies are making lots of money.
So, what’s the problem?
The problem is that the good times don’t necessarily last. Investors tend to pay the highest prices just when performance is likely to slow down. This means that future returns, from stocks bought when prices are high, are usually below those when stocks are bought cheaply. The future is the same in either case. But just as with bonds, the price paid is the primary determinant of future returns. With prices high right now, chances are excellent that future returns—over the next 5 to 10 years—will be worse than what investors expect. Time for caution, rather than exuberance.
This is not just theory; it is actually what has happened in the past. We will take a more detailed look at that tomorrow.


