

 Print
Print Last week, we talked about the deficit, including how it is at unsustainable levels and how it is expected to get worse (much worse) over the next several years. What we left open was when and how the deficit actually turns into trouble.
On the face of it, it isn’t all that clear why it has to. Japan, for example, has been running massive deficits and building up debt for decades now, and it hasn’t collapsed yet. Maybe we don’t need to worry, as we can just keep doing that as well. But let’s take a look and see what that scenario would mean.
The difference between the deficit and the debt
Let’s start by differentiating between the deficit and the debt. The deficit is the annual shortfall between what the federal government gets in revenue and what it spends. The difference is made up by borrowing. The debt is the accumulated deficits over time, less any amount actually paid back during that time period. Deficits, therefore, mean the debt will get larger every year.
Where trouble begins: Interest payments
The connection between the debt and trouble is the interest payments. Governments, unlike people, don’t actually have to pay off debt. Since governments (in theory) live forever, they can just keep rolling it over. They do, however, have to pay the interest on the debt, and that is where trouble can arise. There are two pieces to interest payments: the debt amount and the interest rate. We need to look at both.
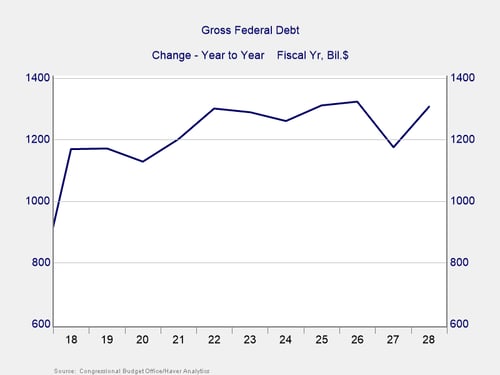
Amount of debt. The chart below takes last week’s projected deficit charts and turns them into a debt increase chart. It’s the same data, slightly different format. As you can see, the Congressional Budget Office (CBO) expects the debt to increase by more than $1 trillion per year for the next 10 years.
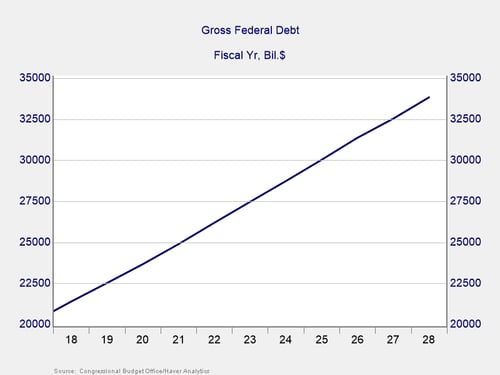
Turning that data into actual debt levels, in the next chart we can see that starting at a 2018 debt level of about $21 trillion, this trend takes us to a debt of about $34 trillion in 2028. This is a fairly consistent trend, adding about $1.3 trillion per year to the debt.
Interest rates. To turn this debt level into debt interest payments, we need to look at what interest rates are likely to do. For the sake of consistency, we will use the CBO interest rate projections for the next 10 years. What matters for our purposes are not the absolute levels but the changes from today over the next 10 years. For both short-term and longer-term rates, the increase is expected to be about 1 percentage point to 1.25 percentage points. Let’s take the lower end of the range and say, on average, that rates charged on the federal debt will go up about 1 percentage point over the next 10 years.
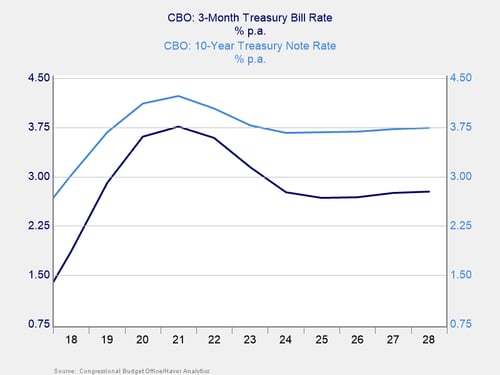
This is actually an optimistic conclusion. It ignores the larger bump in rates in 2019–2022 and leaves rates at what are—compared with history—still very low levels. We may see larger increases. For example, over the past year, the 3-month rate is up a full 1 percent, while the 10-year rate is up 0.72 percent. In both cases, we got as much or almost as much of an increase in the past year as we are projecting for the next 10 years. It could be much worse. Still, for purposes of analysis, let’s use this and see what we get.
The current interest rate on U.S. federal debt is about 2.25 percent (per the U.S. Treasury). It is higher than that, at about 2.8 percent, if you include nonmarketable debt. Once again, let’s be optimistic and use the lower figure. From the current 2.25 percent, we will assume that rates for the U.S. debt will rise, on average, to 3.25 percent in 2028. What would that mean?
Current interest payments are 2.25 percent times $21.2 trillion, or about $480 billion. In 2028, using our assumptions, interest payments will be 3.25 percent times $34 trillion, or about $1.1 trillion.
We have a problem
We can look at this a couple of ways. First, the entire deficit we have now and more will be needed just to pay the interest on the debt within 10 years. Second, interest expenses can be reasonably expected to more than double, requiring an extra $600 billion in revenue to stay even. Any way you look it, however, we have a problem.
Next week, we will take a look at what might be needed to solve the problem.


