

 Print
Print One of the important concerns we face today is the deficit. Although it has been overshadowed recently by the headlines on trade, it is actually a potentially bigger problem and is definitely a more certain one. As such, we need to take a look at exactly what the problem is, what it could mean to our investments, and perhaps most important, whether the problem is solvable—or not.
Let’s start with the facts
You can see in the chart below how the deficit was around $250 billion before the financial crisis. It worsened during the crisis, recovered to about $500 billion in 2014–2016, and then started to get worse again. Now, the deficit is about $750 billion on a trailing 12-month basis.
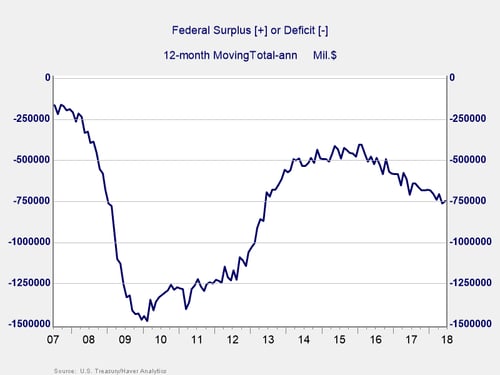
My takeaway here is that the government never got even close to the “normal” of 2007, even during a multiyear recovery. What progress was made, moreover, was largely due to the sequestration act that cut government spending in the face of the fiscal cliff confrontation. That progress started to come undone in 2015 and has been removed entirely with the recent spending agreement in Washington. You can see the results above.
Congressional Budget Office (CBO) deficit projections
One way to look at this problem is that we are now running a deficit that is three times as large as in 2007—and that is with the benefit of a booming economy. Plus, with increased government spending, the deficit is likely to grow even larger. This is certainly the view of the nonpartisan CBO.
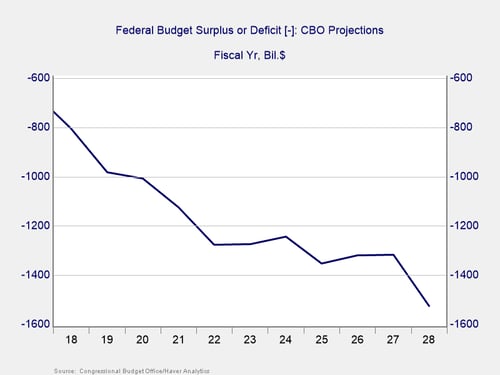
Specifically, the CBO sees the deficit reaching $1 trillion (with a t!) in 2019 and ballooning to $1.5 trillion in 2028.
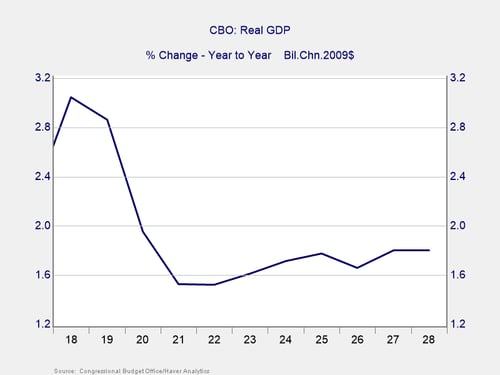
Notably, that worsening deficit is based on optimistic economic projections. Per the chart above, the CBO expects that there will be continued growth over the next 2 years and that growth over the next 10 years will not be all that different from what we've had over the past 10 years.
Significantly, these projections do not include a recession in that time period, which is something that historically has never happened. Why does this matter? Because a recession would both hurt tax receipts and increase spending, making the deficit even worse (as in 2000 and 2008). In other words, the CBO deficit projections, with a $1 trillion deficit in 2019 and getting worse, are something of a best-case scenario. The reality is likely to be worse.
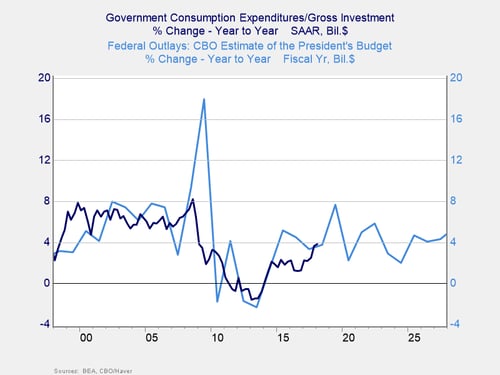
As you can see in the chart above, the CBO has generally done a pretty good job in estimating expenditure growth. So, this is a reasonable future estimate.
An unsustainable trend
Looking at the data, this trend is unsustainable. One of the best quotes in economics, from Herb Stein, is this: “If something cannot go on forever, it will stop.” This level of deficit spending cannot go on forever, so it will stop at some point. The questions are when, why, and what happens next?
Of course, fundamentally, we want to know whether the problem is solvable. One way to determine the answer is to look at the past. Fortunately, the answer is yes, as you can see in the chart above. In 2011—as the sequestration laws kicked in as a response to the fiscal cliff confrontation, when Congress was unable to come to an agreement over taxes and spending—you can see that federal spending actually declined for a couple of years in a row, for the first time ever. That takes care of the spending side. Although that won’t be enough to solve the problem, we also have examples from history of tax increases when necessary. In other words, when the situation gets bad enough, we can solve the problem.
Solving the problem
It won’t be easy to solve the problem, and it certainly won’t be painless. In fact, economically it will hurt a lot, as the sequestration did. But politically, it will hurt even more. As such, nothing will be done until the pain of the problem exceeds the pain of solving the problem.
When we will reach that point is the question that really needs to be answered, and we are not there yet. Let’s take a look at when that might be next week.


