Print
PrintMy colleague Sam Millette, senior investment research analyst on Commonwealth’s Investment Management and Research team, has helped me put together this month’s Economic Risk Factor Update. Thanks for the assist, Sam!
The economic data released last month was mixed, with improvements in service sector confidence offset by declining consumer sentiment. Job creation was also mixed, as the pace of new job growth continues to be below that of 2018. The yield curve remained inverted, with a notable decline in long-term yields during the month. Although we are not yet at immediate risk levels, there are certain areas of the economy that should be watched closely going forward.
The Service Sector
Signal: Yellow light
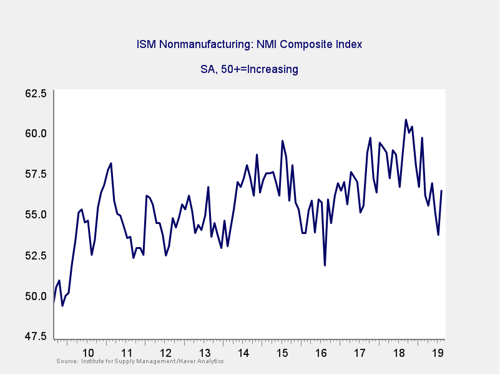
This survey of confidence for the service sector of the economy rebounded last month following two months of declines. This was a better-than-expected result, as economists had forecast a much smaller gain in August. It helped calm fears of a slowdown in the service sector, as any value greater than 50 indicates expansion. Despite the recent uptick in confidence, this indicator remains below highs seen in 2018 and is still a yellow light for now.
Private Employment: Annual Change
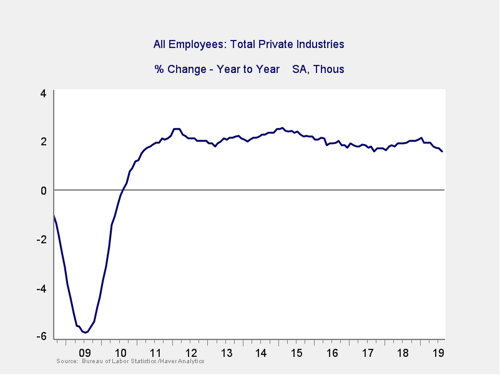
Signal: Green light
August was a mixed month for new jobs. Only 130,000 were added, which was below expectations for 160,000. The underlying data came in better than expected, however. Wages grew faster than anticipated, and unemployment remained flat at 3.7 percent, despite an uptick in the labor force participation rate. With that being said, the job growth rate is clearly trending down on a year-over-year basis. Although we are not currently at risk levels, the slowdown in year-over-year growth should be monitored. For now, we’ll keep this indicator as a green light.
Private Employment: Monthly Change
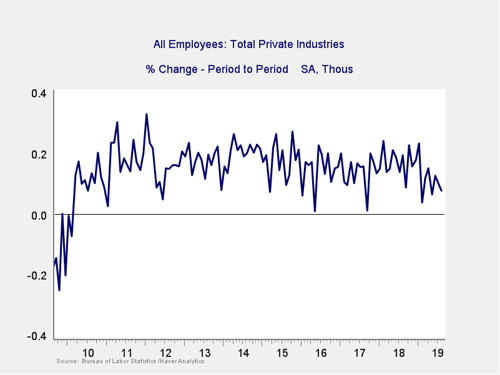
Signal: Yellow light
These are the same numbers as in the previous chart but on a month-to-month basis, which can provide a better short-term signal.
With August’s uninspiring headline jobs figure, the monthly job creation rate remains below levels seen in 2018. Combined with the slowing in the year-over-year figures, this decline in the average monthly growth indicates that the overall pace of job growth is slowing. Due to this slowdown, this indicator remains at a yellow light.
Yield Curve (10-Year Minus 3-Month Treasury Rates)
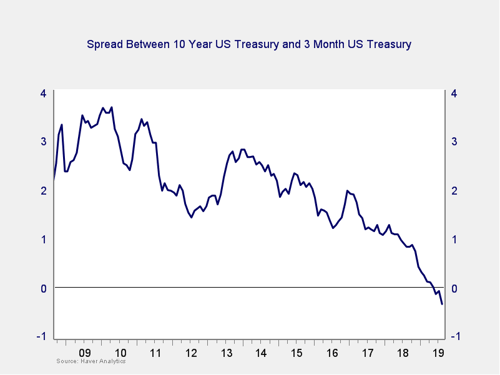
Signal: Yellow light (tending to red)
The yield curve remained inverted in August. Escalations in the U.S.-China trade war during the month caused investors to flock to safe-haven assets, driving down long-term yields. The 10-year Treasury yield fell from 1.90 percent to start the month to 1.50 percent at month-end. The short end of the curve was less affected, with the 3-month Treasury yield starting the month at 2.07 percent and ending the month at 1.99 percent. As the length of the inversion grows, it is getting close to starting a recession countdown. But it is not quite there yet. Given that and the delay between such an inversion and the actual start of a recession, the immediate risk remains low. Recent policy moves and market action suggest risks are rising, however. As such, along with other signs of weakness, the indicator remains something to watch. We are keeping this measure at a yellow light this month.
Consumer Confidence: Annual Change
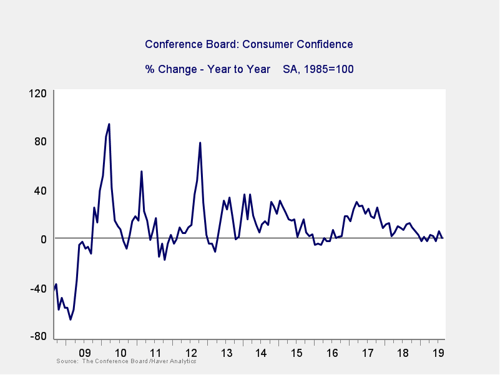
Signal: Yellow light
Consumer confidence fell slightly in August, as equity volatility and escalating trade war concerns weighed on consumers. On an absolute level, consumer confidence remains near post-recession highs. But on a year-over-year basis, confidence growth is still lagging behind the pace we’ve seen over the past few years. As such, this indicator remains a yellow light.
Conclusion: Risk remains elevated
All things considered, this was a month that saw risks gradually increasing across a number of important areas of the economy. The decline in consumer confidence and slowdown in job creation indicate the economy is not immune to the effect of slowing global trade. Although the jump in service sector confidence was a welcome surprise, now we’ll have to wait and see if business owners will be able to translate higher confidence levels into more spending.
Although a continued slowdown remains the most likely case based on the data, a slowdown is not a recession—we likely still have several quarters to go there. Nonetheless, the bulk of the data indicates the risks of a worsening slowdown remain material (again, not yet as the base case). As such, we are leaving the overall risk level at a yellow light for the economy as a whole for September.