Print
Print My colleague Sam Millette, manager, fixed income on Commonwealth’s Investment Management and Research team, has helped me put together this month’s Economic Risk Factor Update. Thanks for the assist, Sam!
The economic recovery gradually continued in September. The September employment report showed that hiring has slowed for the second month in a row, while consumer confidence remained challenged by rising concerns about inflation. It’s important to note that the economy is still growing; however, the sustained slowdown during the month is a reminder that the path and pace of recovery remain uncertain in the months ahead.
On the medical side, risks declined throughout the month as improving vaccination numbers helped mitigate the damage from the most recent wave of infection. We saw new daily cases decline notably, and there were similar improvements in the number of hospitalizations and deaths.
Overall, we’ve kept the economic risk level at yellow for now, but we’ll be keeping a close eye on rising political risks and the continued impact they may have on the economic recovery. As we saw in September, very real risks to the ongoing recovery remain—and these risks should be monitored in the months ahead.
The Service Sector
Signal: Green light
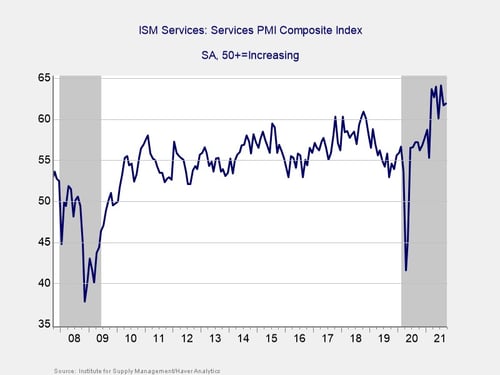
Service sector confidence improved more than expected in September following a decline in August. The ISM Services index increased from 61.7 in August to 61.9 in September, against calls for a decline to 59.9. This is a diffusion index where values above 50 indicate growth. So, this result indicates accelerated growth for the service sector during the month.
As you can see in the chart above, service sector confidence remains well above both the recent lows from initial lockdowns and pre-pandemic levels. Service sector confidence has been supported throughout the year by public health improvements. Associated easing of state and local restrictions has assured business owners of ongoing economic recovery. This better-than-expected result in September indicates healthy expansionary territory despite the most recent wave of infection.
Given the fact that service sector confidence improved during the month and remains well above pre-pandemic levels, we have left this indicator at a green light for now.
Private Employment: Annual Change
Signal: Yellow light
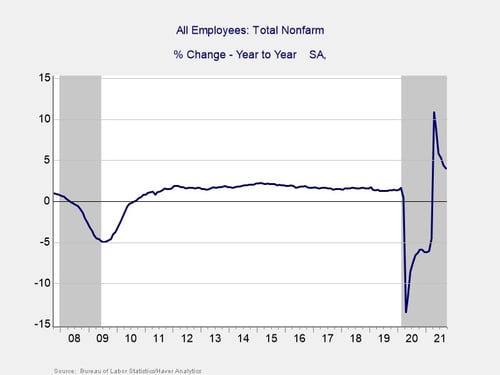
September’s employment report showed that the economy added 194,000 jobs during the month, which was down from the upwardly revised 366,000 jobs added in August and well below economist estimates for 500,000 additional jobs. This disappointing result marks the fewest number of jobs added in a month since last December; however, it does mark nine straight months of job growth.
The year-over-year job growth rate fell from 4.4 percent in August to 4 percent in September. The slowdown in hiring during the month was concerning as the total number of jobs across the economy is still down by roughly 5 million compared to the pre-pandemic peak.
Political uncertainty and continued labor shortages were major drivers of the job growth slowdown in September. This can be seen by the seasonally adjusted loss of 144,000 local government education jobs during the month. Given the slowdown in hiring pace for the second month in a row, we have left this indicator at a yellow light for now, and we will be keeping a close eye on it in the months ahead.
Yield Curve (10-Year Minus 3-Month Treasury Rates)
Signal: Green light
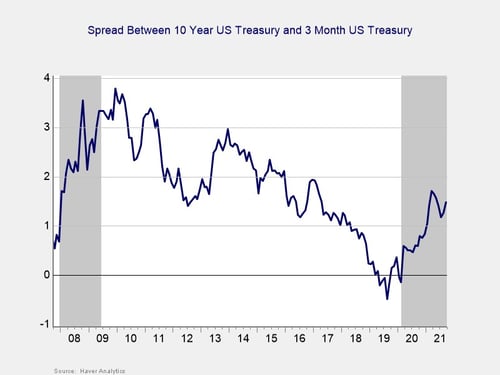
The yield curve steepened in September for the second month in a row. This result was primarily due to rising long-term interest rates, as the 10-year Treasury yield increased from 1.30 percent at the end of August to 1.52 percent at the end of September. The three-month Treasury yield remained unchanged at 0.04 percent at the end of September. While short-term rates are expected to remain low until at least 2023, longer-term rates rose during the month—partially in response to the Fed’s September meeting where the central bank indicated it may start tapering asset purchases by the end of the year. This increase brought long-term yields closer to pre-pandemic levels and the recent highs that we saw in March and April of this year.
Given the fact that long-term yields remain above 2020 lows and we saw a moderate increase in long-term yields during the month, we have kept this signal at a green light for now.
Consumer Confidence: Annual Change
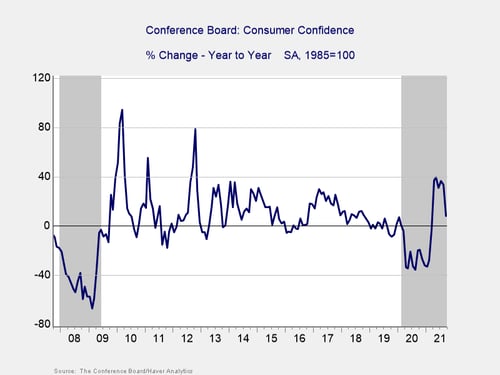
Signal: Green light
Consumer confidence declined more than expected in September. The Conference Board Consumer Confidence Index dropped from 113.8 in August to 109.3 in September against forecasts for a modest increase to 115. This disappointing result brought the index to its lowest level in seven months and was primarily driven by declining consumer optimism in both the current situation and future expectations.
On a year-over-year basis, confidence increased by 7.9 percent in September, down from the 33.5 percent year-over-year increase we saw in August. Despite the slowdown, the index still sits well above the 2021 low of 87.1 percent that we saw in January when the third wave of infection weighed heavily on sentiment.
Historically, declines in confidence of 20 percent or more over the past year are a signal of a recession; the fact that the growth rate remained positive in September was relatively encouraging as it kept the year-over-year figure out of the historical danger zone.
Given the fact that confidence remains well above the lockdown-induced lows and outside of the danger zone on a year-over-year basis, we have left this indicator at a green light for now. With that said, further declines in the months ahead could lead to a downgrade.
Conclusion: Economic Recovery Slows in September
The economic data releases in September largely showed slowing growth for the economy during the month. While we saw the pace of growth slow during the month, it’s important to remember that slowing growth is still growth and that the economy remains in a better spot than earlier in the year.
Looking forward, continued growth remains the most likely path forward; however, as we saw in September, there are real risks that remain to this outlook. The continued slowdown in hiring and declining consumer confidence during the month are concerning and worth monitoring as they may lead to slower spending growth in the months ahead. Ultimately, the pace and path of the expected recovery in the short term are uncertain, and caution is therefore still warranted.
We have left the overall economic risk indicator at a yellow light to reflect continued uncertainty and the potential for setbacks in the months ahead.