Print
PrintMy colleague Sam Millette, senior investment research analyst on Commonwealth’s Investment Management and Research team, plays a key role in putting together the Economic and Market Risk Factor Updates. We are now working on updating the format, and you will see some changes this month and in coming months. Thanks for the great work, Sam!
 The economy continued to recover in September, but the mixed nature of the reports released during the month highlights the continued risks. On a positive note, both service sector and consumer confidence rebounded in September, helping to calm concerns following declines in August. September’s employment report, on the other hand, was weaker than expected, with the pace of new job creation coming in below economist expectations and slowing notably compared with August. Overall, the economic updates released during the month largely reinforced the fact that while the recovery continues, risks remain, and there is still a long way to go to get back to pre-pandemic activity levels.
The Service Sector
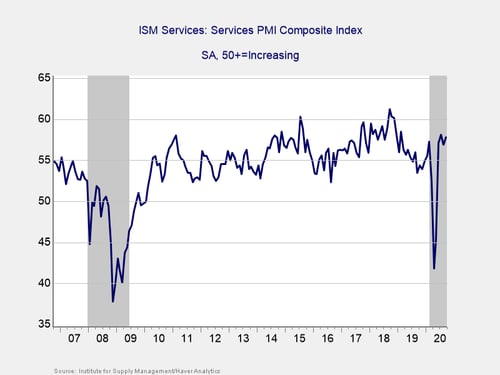
Signal: Green light
This measure of service sector confidence came in above estimates during the month, rising from 56.9 in August to 57.8 in September against calls for a decline to 56.2. This better-than-expected result helped calm concerns about wavering business confidence after the index fell by more than expected in August. Service sector confidence now sits above the pre-pandemic high of 57.3 set in February, highlighting the impressive rebound in business confidence that we’ve seen since reopening efforts began. This is a diffusion index, where values above 50 indicate expansion, so this strong September result is a positive sign for service sector confidence and spending during the month.
The service sector accounts for the lion’s share of economic activity, so the rapid rebound in confidence was a good sign for the ongoing economic recovery. Given the continued growth signal in September, we have left this indicator at a green light for now.
Private Employment: Annual Change
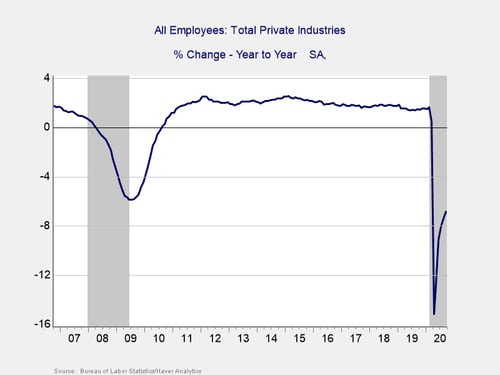
Signal: Red light
September’s employment report showed 661,000 jobs were added during the month, against economist estimates for 859,000 additional jobs. This marks five straight months with job growth, but the pace of job creation has slowed notably, and September’s results represent the smallest monthly increase since reopening efforts began, down notably from the 1.489 million jobs added in August.
Despite the slowdown in the pace of new job creation, the continued job growth in September following four months of improvement indicates that the worst for the job market is likely behind us. With that being said, the damage caused in March and April leaves overall employment levels far below where we were a year ago, and it will take a long time at the current pace to get back to pre-pandemic levels. Total employment remains down 6.8 percent on a year-over-year basis.
The unemployment rate also showed improvement during the month, falling from 8.4 percent in August to 7.9 percent in September. This was a larger decline than expected, but it was partially driven by people dropping out of the workforce, as the labor force participation rate unexpectedly fell during the month. Ultimately, the unemployment rate remains high on a historical basis, and the tailwinds from reopening efforts and government stimulus appear to be fading.
Despite the positive results over the past five months, we’re keeping this indicator at a red light for now, given the fact that overall employment levels are still extremely weak on a historical basis, and there is a long way to go to get back to pre-pandemic employment levels.
Please note: We have removed the month-to-month employment chart from this piece going forward.
Yield Curve (10-Year Minus 3-Month Treasury Rates)
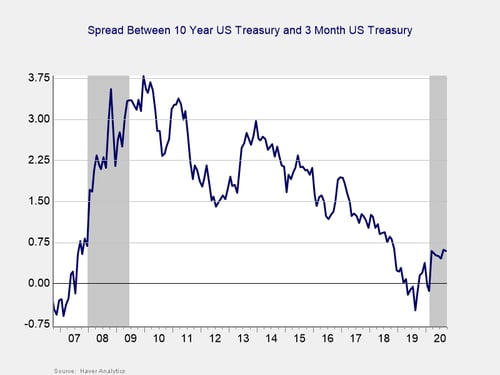
Signal: Red light
The yield curve started the year inverted, and it un-inverted in March, where it has remained throughout the pandemic. This un-inversion was driven by a sharp drop in short-term rates, which was caused by the Fed’s decision to cut the federal funds rate to effectively 0 percent in March. The 3-month Treasury yield fell modestly in September, from 0.12 percent at the start of the month to 0.10 percent at month-end. The 10-year yield also fell modestly, from 0.72 percent to 0.69 percent.
Although an inversion is a good signal of a pending recession, it is when the gap subsequently approaches 75 bps or more that a recession is likely. We finished September with a spread of 59 bps, and the National Bureau of Economic Research (NBER) declared a recession started in February. In light of that, and with the spread remaining near the critical level, we are leaving this indicator at a red light.
Consumer Confidence: Annual Change
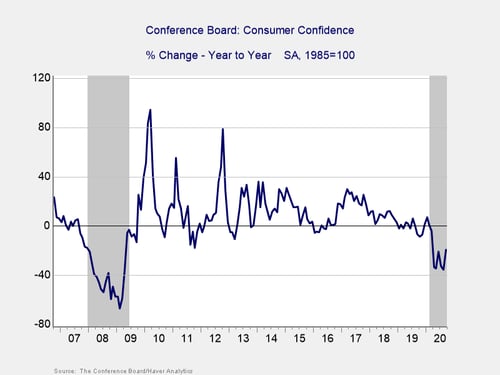
Signal: Red light
Consumer confidence was one of the highlights during the month, with the Conference Board Consumer Confidence Index rising from 86.3 in August to 101.8 in September, against economist estimates for a smaller increase to 90. This better-than-expected result brought the index to its highest level since the pandemic hit and helped calm concerns of faltering consumer sentiment after the index hit a six-year low in August.
Despite the strong result during the month, on a year-over-year basis, confidence is still down by 19.4 percent. While this is an improvement from the 35.7 percent year-over-year decline we saw in August, it is still a concerning result. Confidence declines of 20 percent or more over the past year are typically signals of a recession, which is consistent with the NBER declaration. Given the continued weakness on a year-over-year basis, we have left this indicator as a red light for now.
Conclusion: Moderate Recovery Continues, Yet Risks Remain
September’s mixed data releases highlighted the headwinds the economic recovery still faces despite continued growth during the month. While there were positive developments on the confidence front during the month, there is still a lot of work that needs to be done to get consumer confidence back to pre-pandemic levels. Employment is another area in which positive developments during the month need to be weighed against the considerable amount of work that still needs to be done to get back to pre-pandemic levels.
Ultimately, while September showed the economy continuing on the path of recovery after setting an apparent bottom in April, there is still a long way to go to get back to pre-pandemic levels, and setbacks are likely. Given the mixed results for data releases in September and the damage that was caused in April and March, we are leaving the risk level at a red light for the economy as a whole for October.