Print
PrintMy colleague Sam Millette, senior investment research analyst on Commonwealth’s Investment Management and Research team, has helped me put together this month’s Economic Risk Factor Update. Thanks for the assist, Sam!
Overall, the economic data released last month came in worse than expected. There was a sharp decline in two of our metrics, consumer confidence and service sector business confidence. Job creation was more mixed, as the pace of new job growth remains below that of 2018 but is still at a level above the trouble zone on a year-to-year basis. The yield curve remains inverted, which also keeps that risk metric alive. Although we are not yet at immediate risk levels, conditions continue to deteriorate and the risks have risen.
The Service Sector
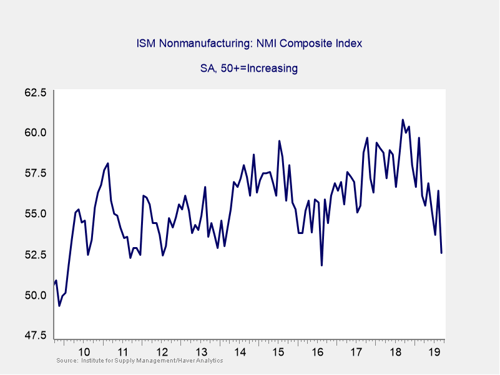
Signal: Yellow light
This survey of confidence for the service sector of the economy fell sharply last month, as a slowdown in current activity and new orders spooked businesses. This result was the largest year-over-year drop in confidence we’ve seen since 2009, and it brings us to a three-year low for the index. This is a diffusion index, where values above 50 indicate expansion. So, we are not yet in a service sector recession, but the clear downward trend in confidence this year is concerning. For now, we’ll keep this indicator at a yellow light.
Private Employment: Annual Change
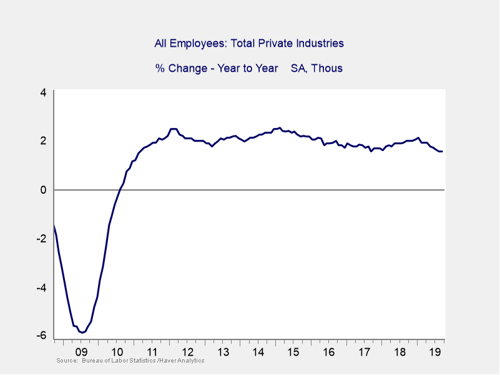
Signal: Green light (shade of yellow)
September was a mixed month for new jobs, as only 136,000 were added against expectations for 145,000. But the underlying data was a bit better: the underemployment and unemployment rates both fell, with unemployment hitting a 50-year low of 3.5 percent. Despite the low unemployment rate, wage growth disappointed during the month by remaining flat. We are not currently at risk levels, but the slowdown in year-over-year growth is worth monitoring. For now, we’ll keep this indicator as a green light, although the ongoing slowdown in job growth is taking us closer to yellow light status.
Private Employment: Monthly Change
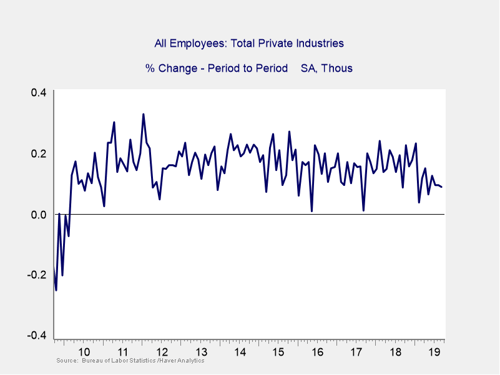
Signal: Yellow light
These are the same numbers as in the previous chart but on a month-to-month basis, which can provide a better short-term signal.
Month-over-month job growth was positive again in September; however, we still sit well below levels seen in 2018. This slowdown in monthly job creation, combined with the slowing year-over-year growth rate, indicates that the overall pace of job growth is slowing. Due to this slowdown, this indicator remains at a yellow light.
Yield Curve (10-Year Minus 3-Month Treasury Rates)
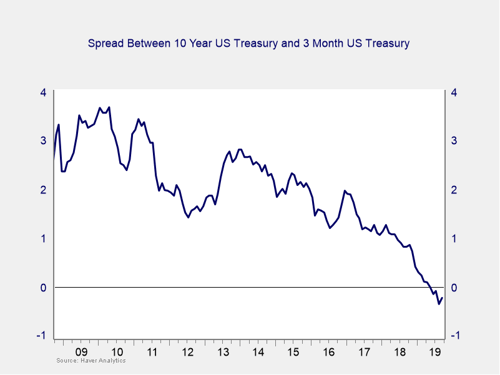
Signal: Yellow light (trending to red)
The yield curve remained inverted in September, despite an increase in long-term rates during the month. The 10-year Treasury yield rose from 1.47 percent to start the month to 1.68 percent at month-end. Yields on the short end of the curve fell during the month, as the Fed cut the federal funds rate at its September meeting by 25 bps, as expected. The yield on the 3-month Treasury fell from 1.98 percent at the start of the month to 1.88 percent by month-end. Market participants widely expect the Fed to cut the federal funds rate by another 25 bps at its December meeting.
As the length of the inversion grows, it is getting close to starting a recession countdown. But it is not quite there yet. Given that and the delay between such an inversion and the actual start of a recession, the immediate risk remains low. As such, along with other signs of weakness, the indicator remains something to watch. We are keeping this measure at a yellow light this month, with a shade of red.
Consumer Confidence: Annual Change
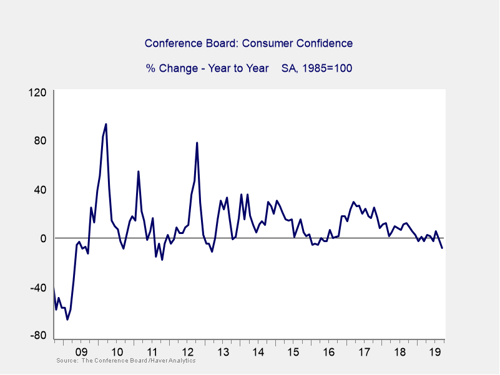
Signal: Yellow light (trending to red)
Consumer confidence fell during the month, from 135.1 in August to 125.1 in September, against expectations for a more modest decline to 133. This represents a 7.5-point decline on a year-over-year basis, which is getting close to the 20-point decline that historically has signaled a recession. Although confidence still sits at high levels on an absolute basis, this year-over-year decline is discouraging, as rising confidence can help support faster consumer spending. The slowdown in job creation and sluggish wage growth this year likely contributed to this drop in consumer confidence. This indicator remains a yellow light for now, but the sudden drop over the past two months has added a shade of red.
Conclusion: Risk remains elevated
All things considered, September saw risks increasing across all of our core metrics. The sudden decline in consumer confidence is especially worrying, as consumer spending has been one of the major drivers of growth for much of this year.
Although a continued slowdown remains the most likely case based on the data, a slowdown is not a recession—we likely still have a couple of quarters to go there. Nonetheless, the bulk of the data indicates the risks of a worsening slowdown remain material (again, not yet as the base case). As such, we are leaving the overall risk level at a yellow light for the economy as a whole for October.