Print
Print My colleague Sam Millette, manager, fixed income on Commonwealth’s Investment Management and Research team, has helped me put together this month’s Economic Risk Factor Update. Thanks for the assist, Sam!
The economic recovery showed signs of acceleration in October after a slowdown in September. The biggest move was in job creation, where the October data not only showed substantially faster growth but also a large upward revision in the weak September data. We also saw a surprise increase in consumer and service sector confidence. While the path and pace of recovery remain uncertain in the months ahead, these results are a sign that the recovery continues to have substantial momentum.
On the medical side, risks declined throughout the month as improving vaccination numbers helped mitigate damage from the most recent wave of infection. We saw daily new cases decline notably, and there were similar improvements in the number of hospitalizations and deaths.
Overall, despite the better news last month, we’ve kept the economic risk level at yellow for now. We’ll be keeping a close eye on the rising political risks and the continued impact they may have on economic recovery. As we saw in September, very real risks to ongoing economic recovery remain and these risks should be monitored in the months ahead.
The Service Sector
Signal: Green light
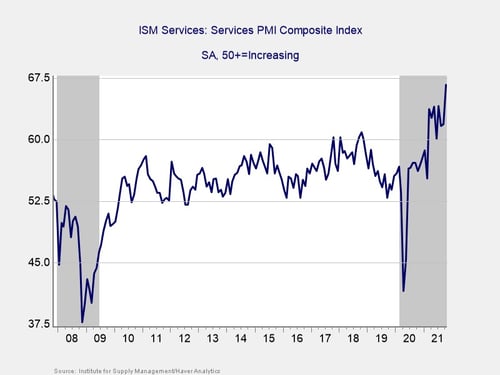
Service sector confidence continued to move higher, with a surprisingly large jump last month. The ISM Services index increased from 61.9 in September to 66.7 in October—the highest level on record. This is a diffusion index, where values above 50 indicate growth. So, this result indicates accelerated growth for the service sector during the month.
As you can see in the chart above, service sector confidence remains well above the recent lows from initial lockdowns and pre-pandemic levels. Service sector confidence has been supported throughout the year by public health improvements. Associated easing of state and local restrictions has reassured business owners of ongoing economic recovery. This better-than-expected result in October indicates healthy expansionary territory despite the most recent wave of infection.
Given the fact that service sector confidence improved during the month and remains well above pre-pandemic levels, we have left this indicator at a green light for now.
Private Employment: Annual Change
Signal: Yellow light
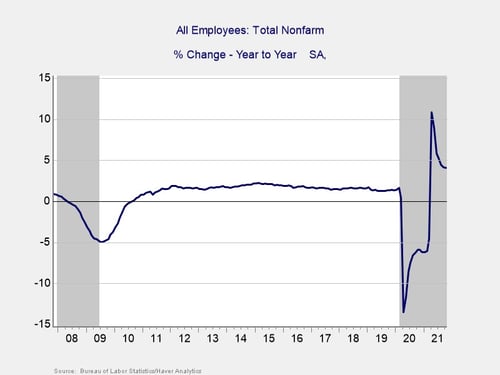
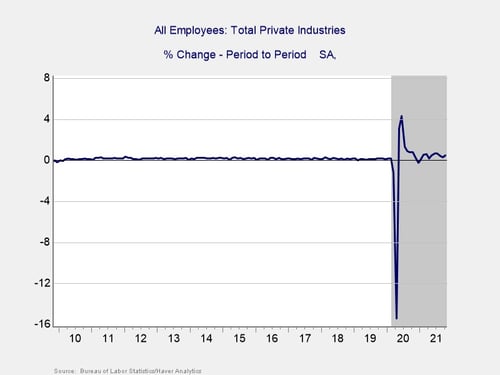
October’s employment report was very strong, with 531,000 new jobs, and September’s job growth was revised from 194,000 to 312,000. August’s number was also revised to 483,000, showing that job growth has been much stronger during the COVID-19 Delta variant wave than was initially reported. October also marks 10 straight months of job growth.
Given the strength of job creation (even during the last wave of the pandemic), it might be time to start thinking about upgrading this indicator to a green light. But, given the recent slowdown in medical improvements, we are going to hold off on this for a while and leave the indicator at a yellow light. That said, the risk from this indicator did tick down in a meaningful way last month.
Yield Curve (10-Year Minus 3-Month Treasury Rates)
Signal: Green light
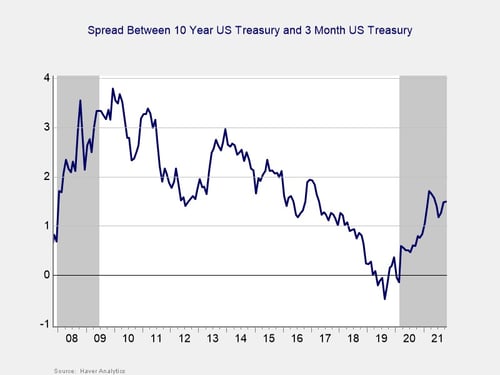
The yield curve steepened in October for the third month in a row. This result was primarily due to rising long-term interest rates, as the 10-year Treasury yield increased from 1.52 percent at the end of September to 1.59 percent at the end of October. The three-month Treasury yield rose from 0.04 percent at the end of September to 0.06 percent at the end of October.
While short-term rates are expected to remain low until at least 2023, longer-term rates rose during the month—partially in response to the Fed’s September meeting where the central bank indicated it may start tapering asset purchases by the end of the year. This increase brought long-term yields closer to pre-pandemic levels and the recent highs we saw in March and April of this year.
Given that long-term yields remain above 2020 lows and that we saw a moderate increase in long-term yields during the month, we have kept this signal at a green light for now.
Consumer Confidence: Annual Change
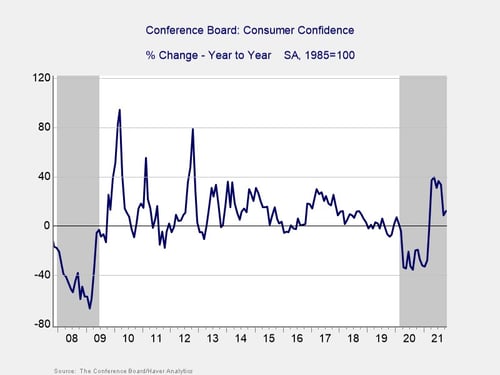
Signal: Green light
Consumer confidence unexpectedly bounced back in October. The Conference Board Consumer Confidence Index rose from 109.3 in September to 113.8 in October against forecasts for a modest decrease. This increase leaves it close to the levels between 2017 and 2019 and suggests the damage from the COVID-10 Delta variant wave may be fading.
On a year-over-year basis, confidence increased by 12.2 percent in October from the 33.5 percent increase we saw in August but up from the weak September number. Despite the slowdown, the index still sits well above the 2021 low of 87.1 percent that we saw in January when the third wave of infection weighed heavily on sentiment.
Historically, declines in confidence of 20 percent or more over the past year are a signal of a recession; the fact that the growth rate remained positive and ticked up in September was relatively encouraging as it kept the year-over-year figure well out of the historical danger zone.
Since confidence remains well above lockdown-induced lows and outside of the danger zone on a year-over-year basis, we have left this indicator at a green light for now. With that said, further declines in the months ahead could lead to a downgrade.
Conclusion: Economic Data Rebounds in October
The economic data releases in October largely showed faster growth for the economy during the month and a rebound from weak September results. Looking forward, continued growth remains the most likely path forward; however, as we saw in September, there are real risks that remain to this outlook. The continued strength in hiring and stabilizing consumer confidence during the month are good news but will need monitoring in the months ahead. Ultimately, the pace and path of the expected recovery in the short term remain uncertain, and caution is therefore still warranted.
We have left the overall economic risk indicator at a yellow light to reflect continued uncertainty and the potential for setbacks in the months ahead.