Print
Print My colleague Sam Millette, senior investment research analyst on Commonwealth’s Investment Management and Research team, plays a key role in putting together the Economic and Market Risk Factor Updates. We are now working on updating the format, and you will see some changes this month and in coming months. Thanks for the great work, Sam!
The economy showed continued growth in October; however, the indicators we track in this piece showed varied results. Despite the mixed nature of the reports, the continued signs of economic growth during the month were encouraging, given the uncertainty created by rising coronavirus case counts and the election. The October jobs report was a highlight, as both the number of new jobs added and the unemployment rate came in better than expected. Business and consumer confidence, however, declined slightly during the month, though they still remain well off the lows. Overall, this was a month that showed continued improvement, as well as the ongoing risk the pandemic represents to the recovery as we head into the end of the year.
The Service Sector
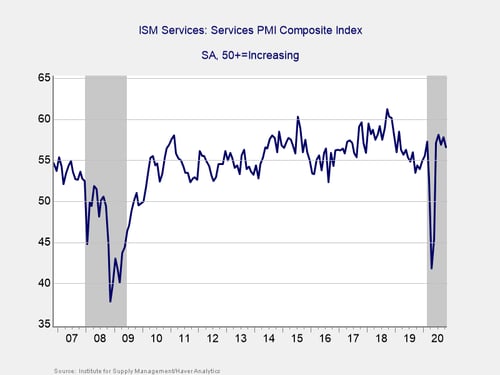
Signal: Green light
This measure of service sector confidence declined by more than expected during the month, falling from 57.8 in September to 56.6 in October, against calls for a drop to 57.5. This is a diffusion index, where values above 50 indicate expansion, so this modest decline leaves the index in expansionary territory. In addition, service sector confidence still sits near the pre-pandemic high of 57.3 that the index hit in February and notably higher than the levels seen throughout much of 2019. The decline in confidence is understandable given the worsening public health picture during the month. November’s report will be widely monitored to see if this decline is the start of a negative trend for business confidence.
Despite the modest decline for the index in October, the rapid rebound in confidence we’ve seen since reopening efforts took effect is a good sign for the ongoing economic recovery. Given the fact that confidence remains in expansionary territory and near pre-pandemic highs, we have left this signal as a green light for now.
Private Employment: Annual Change
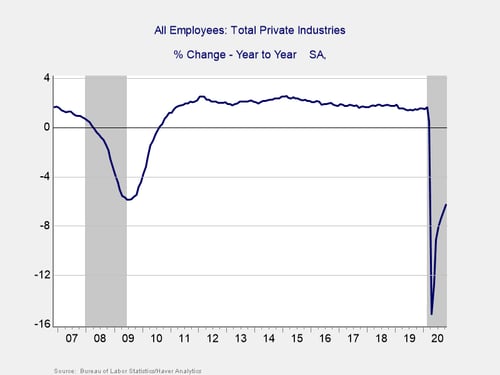
Signal: Yellow light
October’s employment report showed 638,000 jobs were added during the month, which was better than economist estimates for 580,000. This marks six straight months with positive job growth, but it should be noted that the pace of job creation has slowed notably during the recovery. After adjusting for changes in census employment, October showed an increase over the prior month, despite the worsening pandemic, with private employment particularly strong. Overall, the fact that hiring has held up even with the pandemic accelerating is a positive sign.
The unemployment rate showed better-than-expected improvement during the month, falling from 7.9 percent in September to 6.9 percent in October, against calls for a more modest decline to 7.6 percent. The underlying data was positive as well, as this improvement in the unemployment rate coincided with a larger-than-expected increase in the labor force participation rate, meaning more workers returned to the labor market than anticipated.
The continued job growth in October indicates that the worst for the job market is likely behind us. With that being said, the damage caused in March and April leaves overall employment levels far below where we were a year ago, and it will take a long time at the current pace to get back to pre-pandemic levels. For context, we lost more than 22 million jobs between March and April, and we have only been able to add back a little more than half of those jobs since. As a result, total employment remains down 6.3 percent on a year-over-year basis.
Given the resilience of job growth in the past couple of months, we are upgrading this indicator to a yellow light. When job growth turns back up, and that improvement is resilient, it usually signals improvement in the overall economy. Although risks still remain, they appear to have lessened somewhat.
Yield Curve (10-Year Minus 3-Month Treasury Rates)
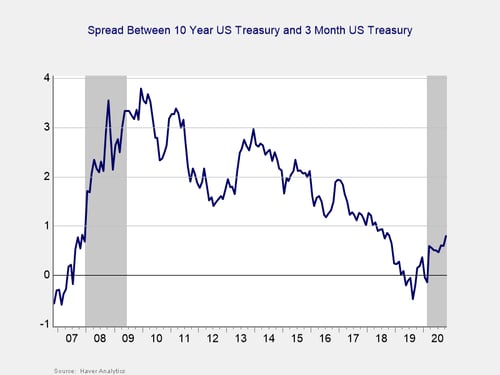
Signal: Red light
The yield curve started the year inverted, and it un-inverted in March, where it has remained throughout the pandemic. This un-inversion was driven by a sharp drop in short-term rates, caused by the Fed’s decision to cut the federal funds rate to effectively zero percent in March. The 3-month Treasury yield fell modestly in October, from 0.10 percent at the start of the month to 0.9 percent at month-end. The 10-year yield rose notably during the month, primarily due to expectations for faster growth and inflation. It increased from 0.69 percent at the end of September up to 0.88 percent at the end of October, its highest level since the end of February.
Although an inversion is a good signal of a pending recession, it is when the gap subsequently approaches 75 bps or more that a recession is likely. We finished October with a spread of 79 bps, and the National Bureau of Economic Research (NBER) declared a recession started in February. In light of that, and with the spread of COVID-19 passing through the critical level, we are leaving this indicator at a red light.
Consumer Confidence: Annual Change
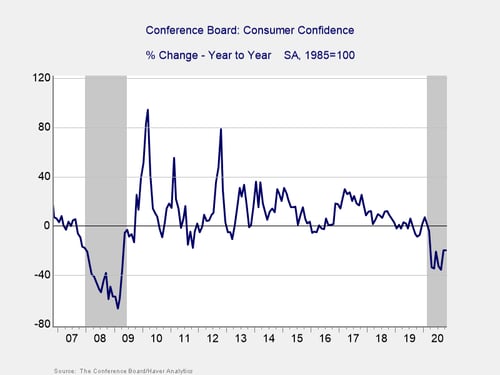
Signal: Red light
Consumer confidence faltered slightly during the month, as the Conference Board Consumer Confidence Index declined from 101.3 in September to 100.9 in October, against calls for a modest increase to 102. On a year-over-year basis, confidence declined by 20 percent during the month, worse than September’s 19.4 percent year-over-year decline. Confidence declines of 20 percent or more over the past year are typically signals of a recession, which is consistent with the NBER declaration.
While the decline for the index in October is disappointing, it makes sense given the uncertainty created by rising case counts and the elections at the start of November. Looking forward, there is hope that more certainty on the political front may bolster confidence as we head into the end of the year, but for the time being, this remains an area to monitor. Given the decline during the month and the continued weakness year-over-year, we have left this indicator as a red light for now.
Conclusion: Moderate Recovery Continues
October’s mixed data releases highlighted the headwinds the economic recovery still faces and the negative impact rising case counts had during the month. While the declines for both service sector and consumer confidence were modest, they need to be watched. The better-than-expected jobs report was certainly a welcome development, but we are still far from where we need to be in terms of overall employment levels for a full economic recovery, and setbacks are likely along the way.
Ultimately, while October showed that the economy continued to grow despite rising case counts and political uncertainty, there were very real signs that the third wave of infections will likely serve as a headwind for short-term economic growth. Given the mixed results for data releases in October and the uncertainty created by the worsening public health picture during the month, we are leaving the risk level at a red light for the economy as a whole for November.