Print
PrintMy colleague Sam Millette, senior investment research analyst on Commonwealth’s Investment Management and Research team, has helped me put together this month’s Economic Risk Factor Update. Thanks for the assist, Sam!
The economic data released in October largely came in better than expected, with increasing service sector and consumer confidence offsetting some of the declines we saw in September. Job creation also came in better than anticipated, and the yield curve normalized for the first time in months. Despite these positive results, the longer-term trends continue to deteriorate, suggesting there are still very real risks in the economy that should be monitored going forward.
The Service Sector
Signal: Yellow light (tending to red)
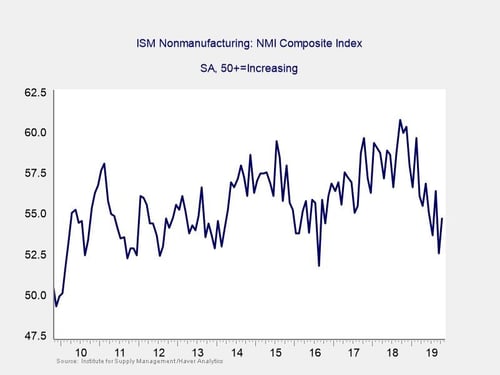
This survey of confidence for the service sector of the economy rebounded during the month, rising from 52.6 in September to 54.7 in October. This result was better than economist expectations for a more modest increase to 53.5. But it was not enough to offset the drops we’ve seen throughout the year, and the longer-term data remains in a downward trend. This is a diffusion index, where values above 50 indicate expansion. So, we are not yet in a service sector recession, but the clear downward trend in confidence this year is concerning. For now, we’ll keep this indicator at a yellow light, trending toward red.
Private Employment: Annual Change
Signal: Yellow light
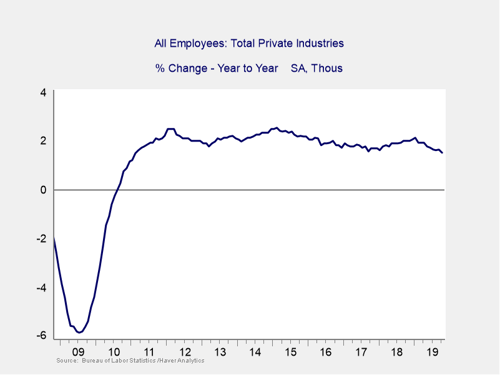
October’s employment report came in largely better than expected. Overall, 128,000 new jobs were added against expectations for 85,000. This was an especially impressive result given the GM strike that lowered the headline jobs figure for the month. Despite the solid October result, the ongoing downward trend continues on an annual basis, and it has now moved close to the risk level. Although we are not currently there, we are now close enough that the ongoing slowdown in year-over-year growth could get us to that level in the next quarter or so. Because of that, we’ll take this indicator down to a yellow light.
Private Employment: Monthly Change
Signal: Yellow light
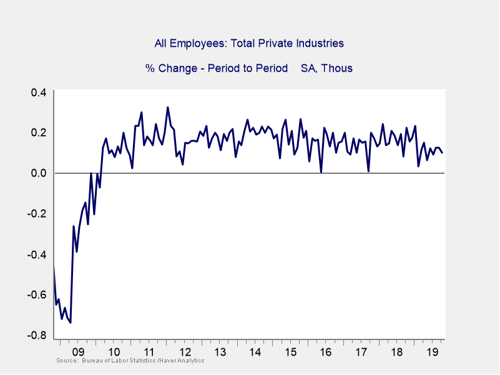
These are the same numbers as in the previous chart but on a month-to-month basis, which can provide a better short-term signal.
Month-over-month job growth was positive again in October; however, we still sit well below levels seen in 2018. This slowdown in monthly job creation, combined with the slowing year-over-year growth rate, indicates that the overall pace of job growth is slowing and is coming close to risk levels. This indicator remains at a yellow light.
Yield Curve (10-Year Minus 3-Month Treasury Rates)
Signal: Yellow light
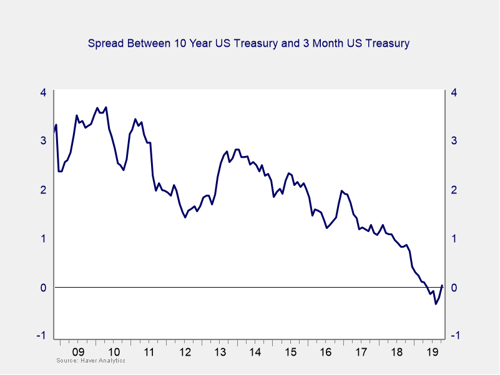
The yield curve un-inverted in October, as yields fell on the short end of the curve. Declining short-term rates were primarily driven by the Fed’s decision to cut the federal funds rate at its October meeting by 25 bps. This marks the third straight meeting where the Fed has cut interest rates, as Fed officials try to support the ongoing economic expansion.
While the return to normalcy between the 10-year and 3-month Treasury rates was a positive development, in many ways, this change does not alleviate the risk. Historically, when the yield curve has un-inverted, we still see a recession within the next 12 months. There is also a real chance of another inversion if long-term rates fall. Plus, if 10-year Treasury yields return to their August lows without a similar move in short-term rates, we would find ourselves inverted again. Given the historical record, and the potential for further inversions in the short term, we are keeping this measure as a yellow light this month.
Consumer Confidence: Annual Change
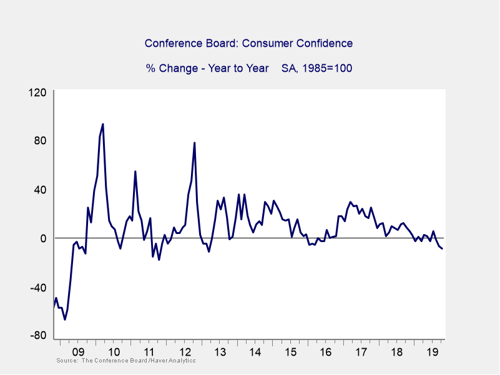
Signal: Yellow light
Consumer confidence increased modestly in October, from 125.1 to 125.9, which was below expectations for a larger increase to 128. Despite the small monthly increase, confidence is still down 8.7 percent from this time last year. While confidence still sits at high levels on an absolute basis, this year-over-year decline is getting close to the red light level of –20, which could put consumer spending growth at risk. The slowdown in job creation and sluggish wage growth this year likely contributed to this drop in consumer confidence, suggesting that risks of further declines remain. This indicator remains a yellow light for now, but further weakness could bring us into the red.
Conclusion: Risk remains elevated
All things considered, October saw risks moderating across a number of important areas of the economy. The increases in both nonmanufacturer and consumer confidence are positive, even if they did not fully offset earlier declines. The surprisingly strong jobs report is also a real positive.
Despite the improvement on a monthly basis, the year-on-year trends indicate that risk continues to rise. Although a continued slowdown remains the most likely case based on the data, the chances of a recession within the next 12 months continue to increase. Right now, however, a slowdown is not a recession, even as the bulk of the data indicates the risks of a worsening slowdown remain material. As such, we are leaving the overall risk level at a yellow light for the economy as a whole for November.