Print
PrintMy colleague Sam Millette, senior investment research analyst on Commonwealth’s Investment Management and Research team, has helped me put together this month’s Economic Risk Factor Update. Thanks for the assist, Sam!
 The economic recovery picked up speed in February, driven by public health improvements and the federal stimulus checks that reached bank accounts. We saw a positive turnaround in consumer confidence and spending figures, along with an acceleration in hiring. We also saw signs of continuing normalization of long-term interest rates, which is a positive signal that the economic recovery remains on track.
Given these improvements, we’ve upgraded the economic risk level to yellow. Although much work remains to return to pre-pandemic levels, conditions are now in place for a faster economic recovery if we continue to show improvements on the public health front.
The Service Sector
Signal: Green light
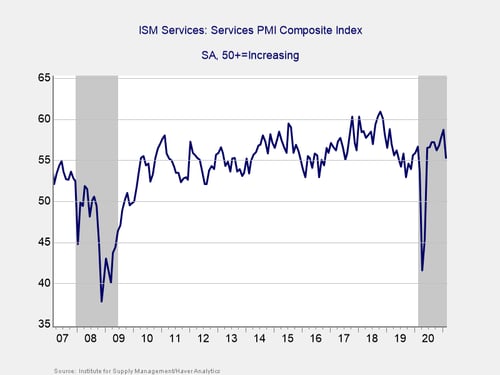
Service sector confidence fell by more than expected during the month, dropping from 58.7 in January to 55.3 in February against forecasts for no change. The decline was partially due to inclement weather throughout much of the country, as a polar vortex disrupted supply chains and caused shipping delays. This is a diffusion index, where values above 50 indicate expansion, so this result still signals healthy levels of service sector confidence despite the likely weather-driven lull.
Service sector confidence has rebounded well since initial lockdowns were lifted last year, and signs indicate the sector may be set for faster growth. The backlog of orders for service sector businesses hit a six-month high in February, pointing toward the potential for faster growth in the coming months. Ultimately, while the decline for the index was slightly disappointing, service sector confidence remains in healthy expansionary territory and may be set to rebound in March as the weather normalizes.
Given that confidence remains in expansionary territory and may rebound soon, we have left this signal as a green light, but we’ll be keeping a close eye on March’s report.
Private Employment: Annual Change
Signal: Red light
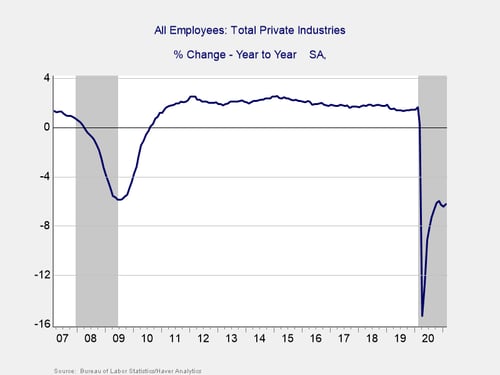
February’s employment report showed the economy added 379,000 jobs during the month, which was an improvement from the upwardly revised 166,000 jobs that were added in January and better than economist estimates for 200,000 additional jobs. This marks two straight months with faster job growth, which is a positive step following the decline in jobs we saw in December. The better-than-expected result was largely driven by the improving public health situation and the easing of state and local restrictions. The hard-hit leisure and hospitality sector added 355,000 jobs in February. The underlying data also showed signs of improvement. The unemployment rate fell by more than expected, declining from 6.3 percent in January to 6.2 percent in February, against forecasts for no change.
Looking forward, continued progress in controlling the third wave of the pandemic should allow local and state governments to continue to lift restrictions, which could serve as a tailwind for an accelerated jobs recovery. With the pace of vaccine distribution increasing across the country throughout the month, we have already started to see improvements gain momentum.
Although there are reasons to hope, the labor market remains under pressure for the time being, as evidenced by the 6.2 percent year-over-year decline in employment we saw in February. Given the continued stress on the labor market, we have left this signal as a red light for now; however, we may upgrade it soon if the labor market recovery continues to accelerate.
Yield Curve (10-Year Minus 3-Month Treasury Rates)
Signal: Green light
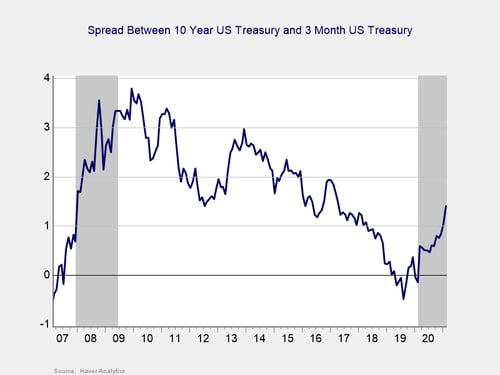
The yield curve started 2020 inverted, and it un-inverted in March, where it has remained throughout the pandemic. This un-inversion was initially driven by a sharp drop in short-term rates, caused by the Fed’s decision to cut the federal funds rate to effectively zero percent in March. The 3-month Treasury yield fell modestly, from 0.06 percent at the end of January to 0.04 percent at the end of February. The widening yield curve was primarily caused by the 10-year yield rising due to increased inflation and economic growth expectations. The 10-year yield increased from 1.11 percent at the end of January to 1.44 percent at the end of February. This brought the 10-year yield close to the pre-pandemic high of 1.51 percent it reached in January 2020. While short-term rates are expected to remain low until at least 2023, longer-term rates now sit near pre-pandemic levels, reflecting a normalization of growth expectations.
Although the spread between the 10-year and 3-month Treasury remains near the recession zone, as longer-term rates have normalized, the spread is approaching the level that historically has signaled a recovery. We have therefore changed this signal to green, reflecting the positive impact from the continued economic recovery on rates.
Consumer Confidence: Annual Change
Signal: Red light
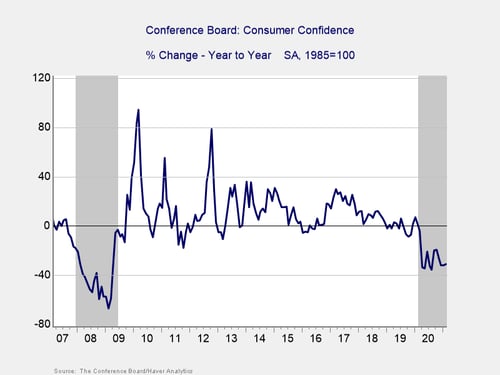
Consumer confidence rose by more than expected, from 88.9 in January to 91.3 in February against forecasts for 90. This result marks two consecutive months with improving consumer confidence, which is a positive sign after the index hit a four-month low in December. This brought the index well above the pandemic-induced low of 85.7 recorded last April.
Despite the monthly improvement, on a year-over-year basis, confidence fell by 31.1 percent in February. Although that was a modest improvement from the 31.8 percent year-over-year decline we saw in January, confidence declines of 20 percent or more over the past year are typically signals of a recession, which is consistent with the NBER declaration. Given the continued year-over-year weakness, we have left this indicator as a red light.
There are signs, however, that consumers have started to feel the positive impact from the improving public health situation and the federal stimulus that was passed at the end of December. With an improving job market and public health picture, it’s possible we will see marked improvements in confidence figures over the next few months. For the time being, however, the large year-over-year decline in confidence indicates much work remains to return to pre-pandemic levels.
Conclusion: Economic Recovery May Have Turned a Corner in February
February showed signs of an accelerating economic recovery, driven by public health improvements and the tailwind from additional stimulus checks reaching bank accounts. The return to consumer spending growth and accelerated job growth were positive signs that the recovery picked up steam during the month, and there is hope for an even faster recovery as more of the country gets vaccinated.
With that being said, year-over-year growth remains relatively weak, as shown by the still-large declines in employment and consumer confidence figures in February. Despite the year-over-year weakness, both indicators showed improvement recently, which could be a sign of an impending acceleration for the economic recovery.
Given continued public health risks and weakness in year-over-year data, it’s too early to say we are out of the woods, but there are signs of light filtering through the trees. The positive progress in February was encouraging enough that we’ve upgraded the overall risk level to yellow, with a further upgrade possible sooner rather than later if the recovery continues to accelerate over the next few months.