Print
Print My colleague Sam Millette, manager, fixed income on Commonwealth’s Investment Management and Research team, has helped me put together this month’s Economic Risk Factor Update. Thanks for the assist, Sam!
The economic reports released last month largely showed continued economic growth. The May employment report showed that the pace of hiring remained strong during the month, which was an encouraging signal that the economic recovery remains healthy despite the headwinds created by high levels of inflation. That said, both service sector and consumer confidence continued to decline, which could be a headwind for future spending growth.
On the medical side, daily new case growth declined in May and remained well below the highs we saw earlier in the year. Looking forward, high levels of vaccination and natural immunity from previous exposures are expected to limit the economic damage from the pandemic.
Despite the continued economic growth, high levels of inflation, the Fed’s plans for tighter monetary policy throughout the year, and the uncertainty caused by the Russian invasion of Ukraine remain. We have left the overall risk level at a yellow light for now.
The Service Sector
Signal: Yellow light
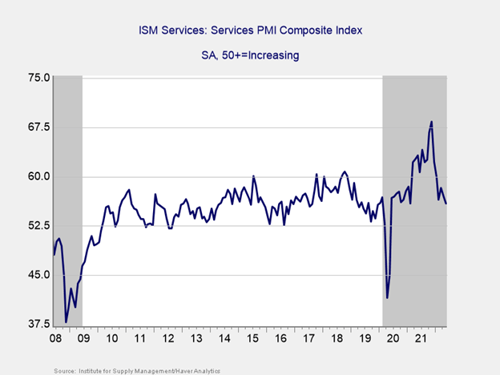
Service sector confidence declined by more than expected in May, as the ISM Services index fell from 57.1 in April to 55.9 in May against calls for a more modest decline to 56.5. The larger-than-expected drop in service sector confidence during the month was primarily due to supply constraints and rising labor costs. This is a diffusion index where values above 50 indicate growth, so this result still signals continued expansion.
As you can see in the chart above, service sector confidence remains well above the lows from initial lockdowns and near pre-pandemic levels despite the larger-than-expected drop during the month.
While confidence remains in expansionary territory, the recent relative weakness of the index is a potential cause for concern and highlights the challenges businesses are facing due to rising prices and labor shortages. Given that the index hit a two-year low in May, we have left this indicator as yellow for now with an eye for future downgrades if we see further declines.
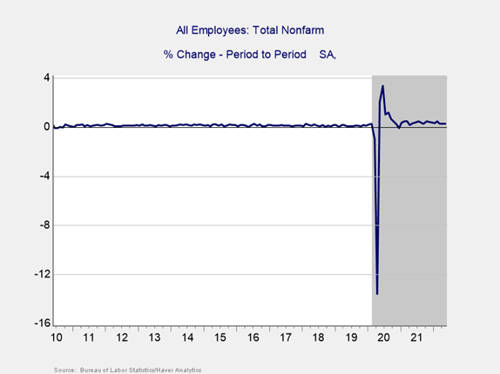
Private Employment: Annual Change
Signal: Green light
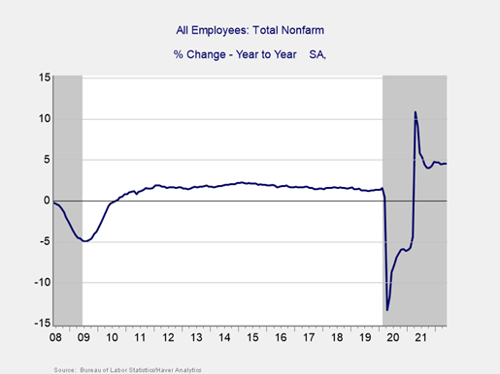
May’s employment report showed that 390,000 jobs were added during the month, which was better than the 318,000 jobs that were projected and only slightly below the upwardly revised 436,000 jobs that were added in April. The strong May result marks 17 consecutive months of solid job growth and indicates that the labor market recovery continued at a healthy pace despite headwinds created by employment costs and labor shortages.
The underlying data was also encouraging. The unemployment rate remained at 3.6 percent in May, which ties the lowest level since the start of the pandemic and is largely in line with pre-pandemic levels. Wage growth also moderated on a monthly and year-over-year basis, which is a positive sign of the Fed’s efforts to tame inflation.
Given the better-than-expected job growth in May and the solid underlying data, we have left this indicator at a green light for now.
Yield Curve (10-Year Minus 3-Month Treasury Rates)
Signal: Green light
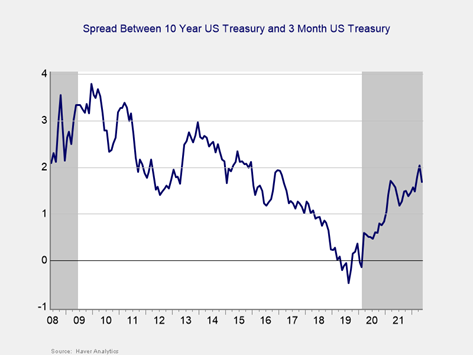
The yield curve flattened in May. This result was caused by rising short-term rates and modestly lower long-term rates during the month. The 3-month Treasury yield increased from 0.85 percent at the end of April to 1.16 percent at the end of May. The 10-year Treasury yield fell from 2.89 percent at the end of April to 2.85 percent at the end of May.
The rise in short-term yields was primarily due to tighter monetary policy from the Fed and high levels of consumer and producer inflation. The Fed has hiked the federal funds rate by 75 bps so far this year, and economists expect to see the Fed focused on combating inflation in 2022. This could lead to larger and more frequent rate hikes as the central bank tries to normalize monetary policy. While tighter monetary policy could lead to some market volatility, it is an encouraging signal that the Fed views the economy as healthy enough to endure a faster return to normal.
Given the fact that the spread between the 3-month and 10-year Treasury rates remains well outside of the historical inversion danger zone, we have left this signal at a green light for now.
Consumer Confidence: Annual Change
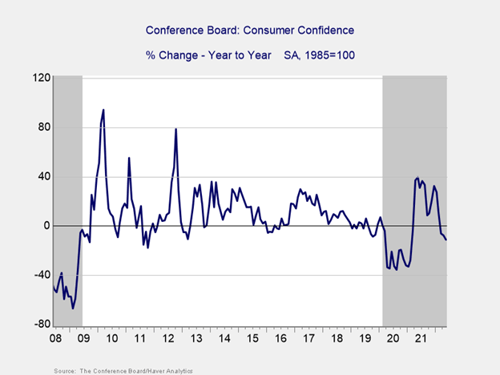
Signal: Yellow light
Consumer confidence dropped from an upwardly revised 108.6 in April to 106.4 in May against calls for a further drop to 103.6. On a year-over-year basis, confidence declined by 11.3 percent in May, which followed a 7.6 percent year-over-year decline in April.
Historically, declines in confidence of 20 percent or more over the past year are a signal of a recession; the fact that the year-over-year figure remained outside of the historical danger zone in May was reassuring. That said, this marks the first three consecutive months with year-over-year declines in confidence in more than a year, which is a potential cause for concern.
Given the fact that confidence continued to decline on a year-over-year basis in May, we have left this indicator at a yellow light for now, although further year-over-year declines in the months ahead could lead to a downgrade.
Conclusion: Growth Continues, But Risks Remain
The data releases in May continued to show signs of economic growth despite concerns about inflation and the Russian invasion of Ukraine. Looking forward, further economic growth remains the most likely path forward; however, as we’ve seen throughout the pandemic and the start of the year, there are real risks that remain in this outlook.
The continued strong hiring growth during the month was good news, but it’s still too early to say the job market is back to full pre-pandemic levels. The declines in service sector and consumer confidence were potentially concerning and both should be monitored in the months ahead. Ultimately, the pace and path of the expected recovery in the short term remain uncertain. Therefore, caution is still warranted.
We have left the overall economic risk indicator at a yellow light to reflect continued uncertainty and the potential for new setbacks in the months ahead.