Print
PrintMy colleague Sam Millette, senior investment research analyst on Commonwealth’s Investment Management and Research team, has helped me put together this month’s Economic Risk Factor Update. Thanks for the assist, Sam!
The economic data releases in May continued to show the significant damage to the economy caused by the shutdown to combat the coronavirus over the past few months. In fact, the National Bureau of Economic Research (NBER) announced that the economy entered into a recession in February, confirming what many economists previously believed. That said, there were real signs of improvement during the month. Business and consumer confidence stabilized in May, while the jobs report came in far above expectations. Despite these positive results, we still have a long way to go to get back to a healthy economy, with all the major indicators we track in this piece still at red light levels.
The Service Sector
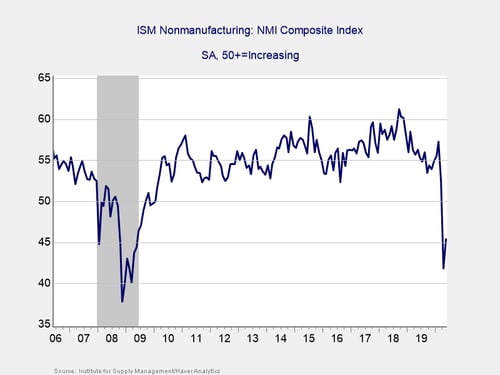
Signal: Red light
This measure of service sector confidence increased modestly during the month. It rose from 41.8 in April to 45.4 in May, against expectations for a smaller increase to 44.4 and following a drop from 52.5 in March. This better-than-expected result was welcome. But this is a diffusion index, where values below 50 indicate contraction. As such, the index still remains at contractionary levels, with confidence well below the 50+ level needed to support a swift economic recovery. While the stabilization of business confidence in May was a positive development, we have a long way to go before the index approaches the normal levels needed to support the increased business spending that will help stimulate overall economic growth. Given that, we are leaving this indicator at a red light.
Private Employment: Annual Change
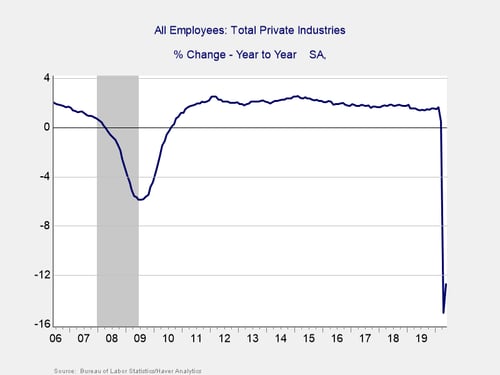
Signal: Red light
May’s employment report came in far above expectations, with 2.5 million jobs added during the month, against economist estimates for a loss of 7.5 million jobs. The unemployment rate fell to 13.3 percent, down from 14.7 percent in April and significantly better than the rise to 19 percent expected. The underlying data was positive as well, with average hours worked and the labor force participation rate both increasing.
These positive results for the May jobs report indicate that the worst of the damage to the job market may be behind us, with many businesses reopening and bringing people back to work. Nonetheless, the massive damage caused in March and April still leaves us well behind where we were at the start of the year and with a long road back to full recovery. Therefore, we are leaving this indicator at a red light for now.
Private Employment: Monthly Change
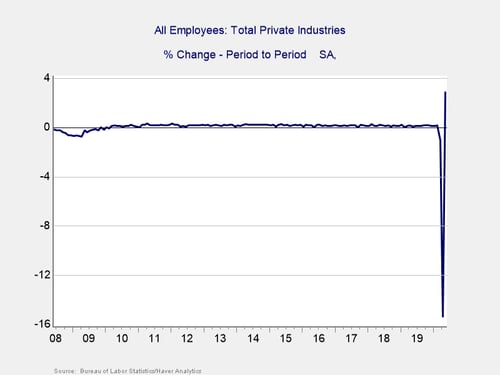
Signal: Red light
These are the same numbers as in the previous chart but on a month-to-month basis, which can provide a better short-term signal. While May’s better-than-expected results were certainly welcome, the report needs to be viewed in context. We lost more than 20 million jobs in April, so the addition of 2.5 million jobs in May represents only a start to the recovery. To put this report into further context, the current unemployment rate of 13.3 percent is the second-worst monthly result since World War II. Given the massive disruption to the job market in March and April and the still historically high unemployment rate, we are leaving this indicator at a red light.
Yield Curve (10-Year Minus 3-Month Treasury Rates)
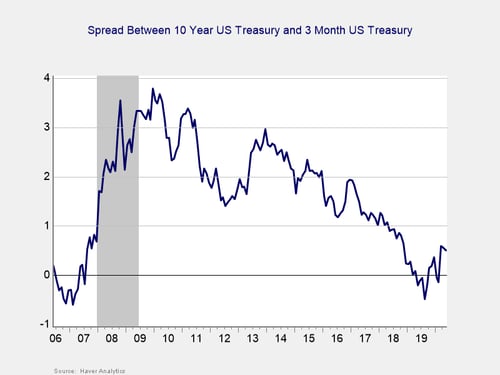
Signal: Red light
After spending the fourth quarter un-inverted, the yield curve re-inverted in January, remained inverted throughout February, and un-inverted again in March, where it remained through April and May. This un-inversion was driven by a sharp drop in short-term rates, which in turn was caused by the Fed’s decision to cut the federal funds rate to effectively zero percent in March. The yield on the 3-month Treasury remained largely range bound in May, rising modestly from 0.09 percent at the end of April to 0.14 percent at the end of May. The 10-year yield also increased modestly during the month, up from 0.64 percent to 0.65 percent.
While an inversion is a good signal of a pending recession, it is when the gap subsequently approaches 75 bps or more that a recession is likely. We finished May with a spread of 51 bps, just as the NBER announced that a recession had indeed started. In light of that, and with the spread remaining near the critical level, we are leaving this indicator at a red light.
Consumer Confidence: Annual Change
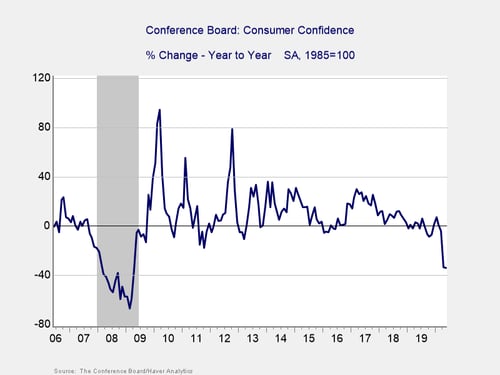
Signal: Red light
Confidence rose from a downwardly revised 85.7 in April to 86.6 in May. This result was slightly worse than expectations for an increase to 87, but it is still a step in the right direction. Despite the month-over-month increase in May, on a year-over-year basis, confidence is down a concerning 34 percent, which is the worst year-over-year decline in more than a decade. Confidence declines of 20 percent or more over the past year are typically signals of a recession, which again is consistent with the NBER declaration. Given the continued weakness on a year-over-year level, we have left this indicator as a red light for now.
There are signs of hope looking forward, as consumer expectations increased as the country started to reopen during the month. Confidence stabilizing on a month-to-month basis while the economy reopens indicates that consumers are likely optimistic that reopening efforts will be successful. Historically, improvements in confidence have supported faster consumer spending growth. So, this will continue to be a widely monitored release, as hopes of a swift economic recovery largely rely on a swift rebound in consumer confidence and spending figures.
Conclusion: Economy in recession, but worst may be behind us
While many of the May releases came in better than expected, the economy remains weak despite the signs of a turnaround, and there are very real risks to the progress we’ve made. On the virus front, we have not seen a large surge in cases following reopening efforts, but the risk of a second wave of infections and a return to shelter-in-place orders is real. There are also other risks to watch out for, including rising trade tensions between the U.S. and China, as well as growing social unrest here at home.
Ultimately, while May showed the economy taking its first steps on the path of recovery from an apparent bottom in April, there is still a long way to go to get back to pre-pandemic levels, and setbacks are likely as we go. Given the continued low levels of economic activity and the damage that was caused in April and March, we are leaving the overall risk level at a red light for the economy as a whole for June.