

 Print
PrintThe news this month is much better than last, with the most recent economic data showing sharp increases against previously worrying downward trends. Although one month’s data won’t undo those trends, the consistency of the reversal across multiple data sets and the magnitude of the positive surprises are very encouraging.
In short, there’s a real possibility that the weakness of recent quarters may be passing.
The Service Sector
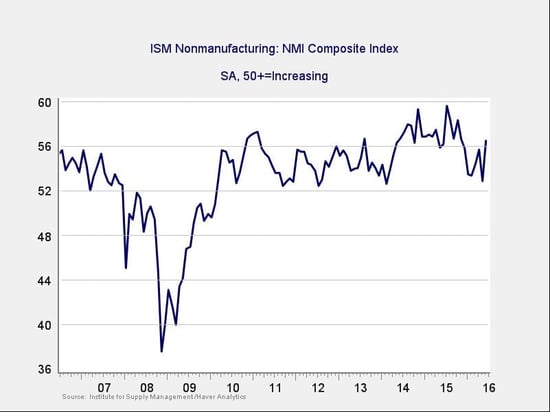
Signal: Green light
After dropping close to its lowest levels since the financial crisis, service sector sentiment staged a sharp rally. The metric increased by much more than expected, returning to levels seen only twice since the crisis (and actually above precrisis levels). Though we shouldn’t get too excited over one month of data, the bounce higher suggests a more encouraging stance going forward, especially since it has coincided with improving consumer confidence and spending. Ongoing business and employment expansion look increasingly likely, and we may have to revise our expectations up.
Continued strength in the service sector is consistent with business confidence; as a representative sample of the largest sector of business, this is an important leading indicator.
Private Employment: Annual Change
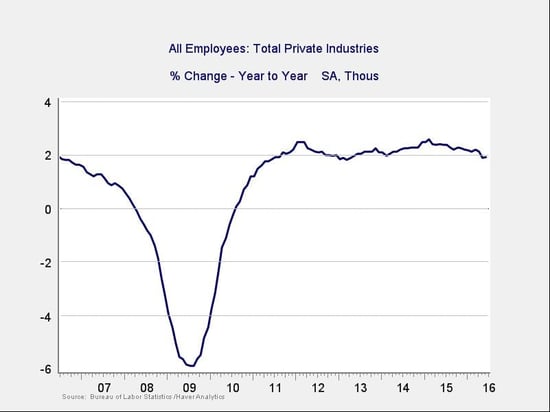
Signal: Green light
June’s strong job creation numbers more than reversed the weak report the previous month, even taking into account the effects of the Verizon strike, which affected both. The annual trend, although down, has at least stabilized with this month’s data and is at levels consistent with steady growth like we saw in the mid-2000s. The next couple of months will be critical to see if job growth remains around those levels.
Because this is an annual figure, the changes are slower and smaller than those we see in more frequently reported data. Overall, despite the volatility of employment growth, I'm giving this indicator a green light.
Private Employment: Monthly Change
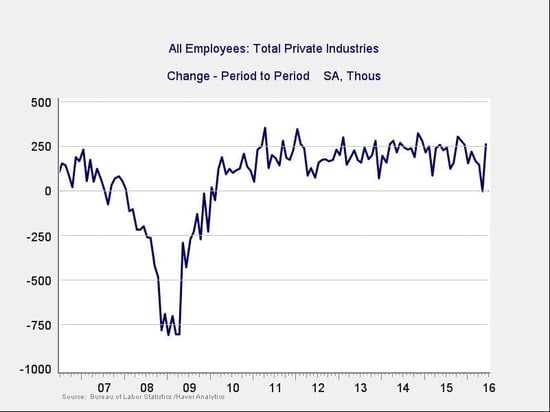
Signal: Green light, but needs to be watched
These are the same numbers as in the previous chart, but on a month-to-month basis, which can provide a better short-term signal. May’s job creation was the worst in the past five years, but June’s strong number, released yesterday, brings us back to healthy levels and suggests May was just an outlier. It also suggests that the noisy downward trend over the past several months may have been just that—noise.
Given the strong number this month, this metric remains a green light, but I will be watching it to confirm that the positive data continues.
Yield Curve (10-Year Minus 3-Month Treasury Rates)
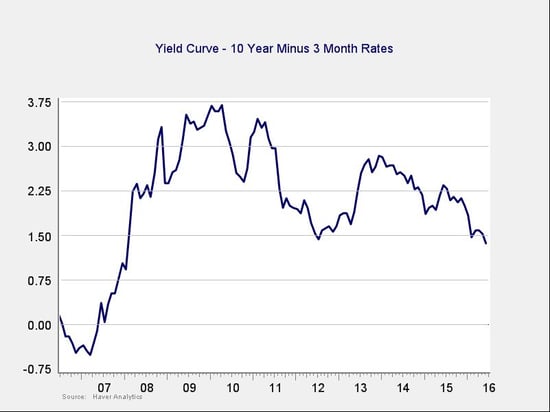
Signal: Green light
After the surprise Brexit vote rattled international investors, rates for the 10-year Treasury dropped as capital moved into U.S. assets, and the spread between long-term and short-term rates narrowed accordingly. The spread remains at healthy levels, but the trend is still generally negative as the yield curve continues to flatten.
The negative risk here is much smaller than in the other indicators; unlike in past cases, the drop in longer rates appears to be driven by foreign investors’ demand rather than U.S. economic weakness. Given that, and the level of the spread, this indicator is still in healthy territory.
Consumer Confidence: Annual Change
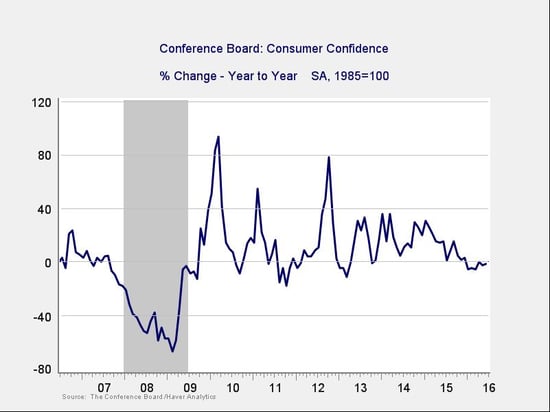
Signal: Yellow light
Consumer confidence increased substantially, beating expectations, and the year-on-year growth rate ticked back up. Although the year-on-year change remains below zero, it has moved further away from the trouble zone and appears to be in a positive trend. This is the third year in a row that we’ve seen a difficult first quarter, and recent data suggests consumers have only just started moving past that.
This month’s improvement is real, but given how recent the positive trends are, we’ll leave this metric at a yellow light until we get a couple more months of positive news.
Conclusion: Economy healthy, negative trends may be reversing
The wide range of improvements in these key metrics largely reverses the declines we’ve seen lately, suggesting the weak trends of the past two quarters may be breaking. We’ve seen pullbacks like this before in the recovery, and the reversal of the most recent one would simply be in line with previous experience.
We certainly need to watch how things evolve, but given the generally healthy levels of the most recent data and the real possibility that trends are turning favorable, the signal for the economy remains a green light.


