

 Print
PrintOnce again, it’s time for our monthly update on risk factors that have proven to be good indicators of economic trouble ahead. As expected, the data hasn’t changed much from last month—it remains positive in all areas and has continued to improve in many cases—but it’s still important to keep an eye on things.
Heading into July, though, the economic forecast remains sunny.
The Service Sector
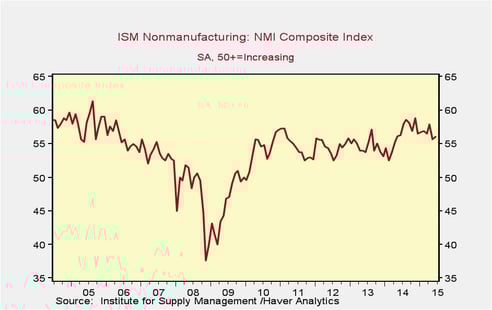
Signal: Green light
June’s service sector data showed a small recovery from the previous month’s decline. Overall, this data point remains close to its highest level since before the financial crisis and is well into the positive economic growth zone. Continued strength in the service sector is consistent with business confidence; as a representative sample of the largest sector of business, this is an important leading indicator.
Private Employment: Annual Change
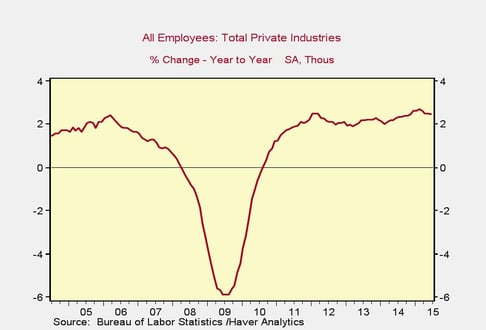
Signal: Green light
Private employment growth year-on-year continued to increase, remaining close to its highest point since 2012. Because this is an annual figure, the changes are slower and smaller than those we see in more frequently reported data, but the trend continues to be in the right direction.
Private Employment: Monthly Change
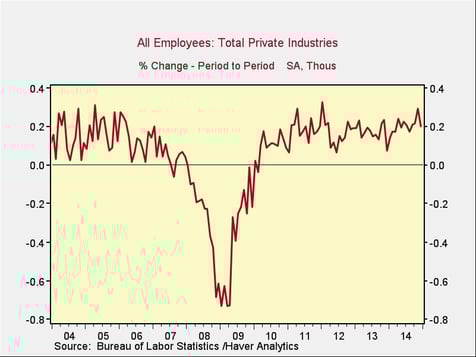
Signal: Green light
These are the same numbers as in the previous chart, but on a month-to-month basis, which can provide a better short-term signal. The June report showed a slight decline from the previous month but remained at a growth level consistent with the mid-2000s. Total employment growth continues to be healthy.
Yield Curve (10-Year Minus 3-Month Treasury Rates)
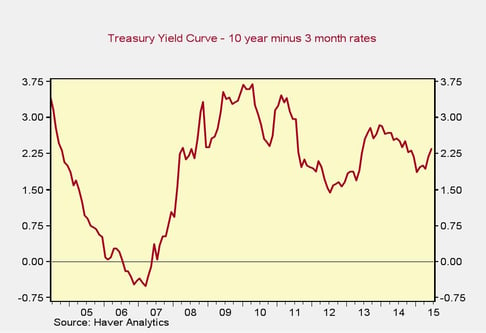
Signal: Green light
Rates for the 10-year Treasury ticked up slightly over the past month while 3-month rates declined slightly. Although the spread between long-term and short-term rates widened a bit, it remains at healthy levels. This metric has not changed significantly despite the prospect of interest rate increases by the Federal Reserve in the near future, possibly thanks to demand from international buyers.
Consumer Confidence: Annual Change
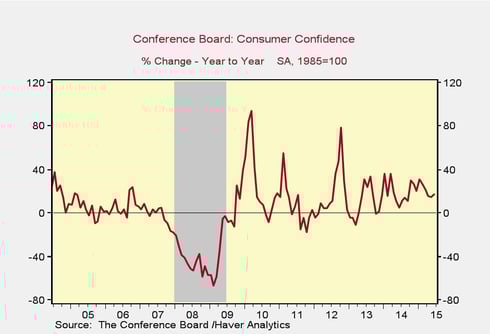
Signal: Green light
Consumer confidence increased in June and remains at one of the highest points since the financial crisis, well above levels of a year ago. The annual rate of change ticked up as well and remains at very healthy levels.
Conclusion: Blue Skies
All of the major signs continue to be positive, despite a first-quarter slowdown and recent economic and political turbulence. Although growth may be slower, it appears likely to continue, and there are encouraging signs that it may even accelerate later in the year.


