

 Print
PrintThe news this month continues to be good, with more positive data almost across the board. This is the second month of reversal against the downtrend that developed in 2016, which suggests a real change of course. Although we need more data to be fully confident, the consistency of the positive reversal across multiple data sets and the magnitude of the positive surprises are very encouraging.
The Service Sector
Signal: Green light
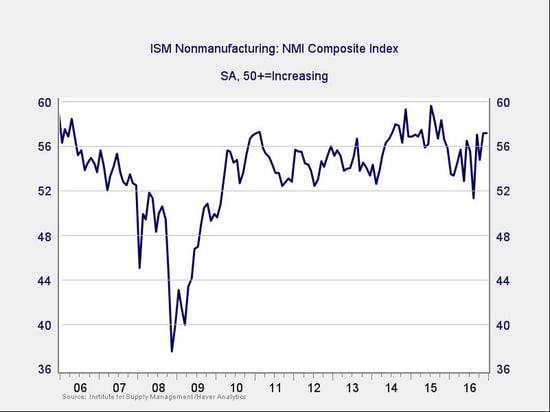
After dropping close to its lows since the financial crisis, service sector sentiment staged a sharp though volatile rally. Against expectations, it maintained its higher position last month—a level we have seen only twice since the crisis. After the recent volatility, with the index spiking and dropping, the sustained high level suggests a more encouraging stance going forward, especially since it has coincided with improving consumer confidence and spending. Ongoing business and employment expansion look increasingly likely, and we may have to revise our expectations up.
Continued strength in the service sector is consistent with business confidence; as a representative sample of the largest sector of business, this is an important leading indicator.
Private Employment: Annual Change
Signal: Green light
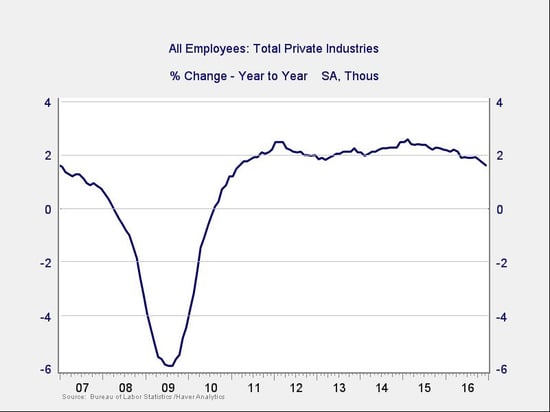
December job creation came in somewhat below expectations, but the details are consistent with a relatively strong, late-cycle job market. Job growth remains consistent with a slowing trend, and wage growth has started to accelerate as the labor market tightens. The annual growth trend is slowing but remains at levels consistent with stable growth.
Because this is an annual figure, the changes are slower and smaller than those we see in more frequently reported data. Overall, given the volatility of employment growth, this indicator remains a green light.
Private Employment: Monthly Change
Signal: Green light, but needs to be watched
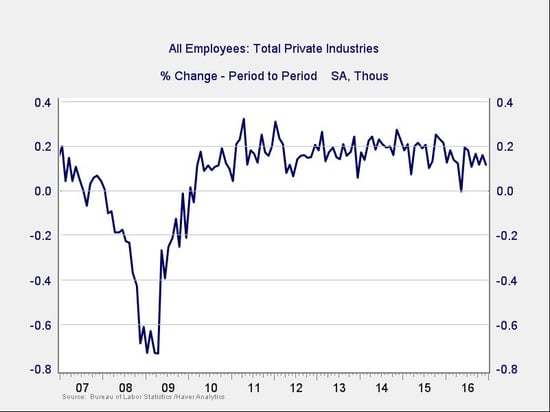
These are the same numbers as in the previous chart but on a month-to-month basis, which can provide a better short-term signal. December job creation was somewhat below expectations, but upward revisions to previous months and stronger wage growth were better than the headline number would suggest. Despite the tightening labor market, job growth remains within the range of the past couple of years.
We do seem to be seeing a weakening of the monthly data, but that is consistent with the late stage of the employment cycle and probably not a cause for concern in the short term. We’ll keep this at a green light, but I will be watching it to see how the slowdown in job growth evolves.
Yield Curve (10-Year Minus 3-Month Treasury Rates)
Signal: Green light
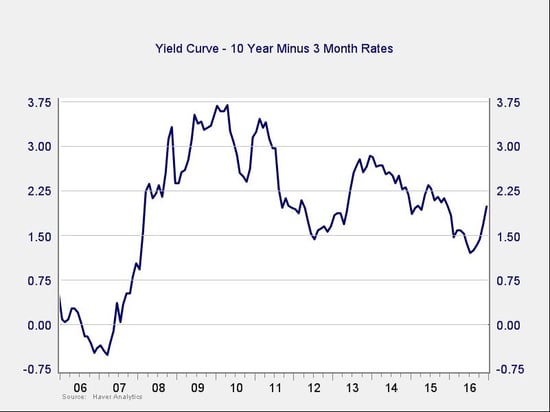
Expectations of faster growth and higher inflation drove up rates for the 10-year Treasury substantially after the election, and that trend has continued. With short-term rates up only slightly on the increase in the fed funds rate, the spread between them has increased, moving into the healthy range. This wider spread takes us even further outside the risk zone, and the change in trend remains encouraging. Given that, this indicator is in healthy territory and remains a green light.
Consumer Confidence: Annual Change
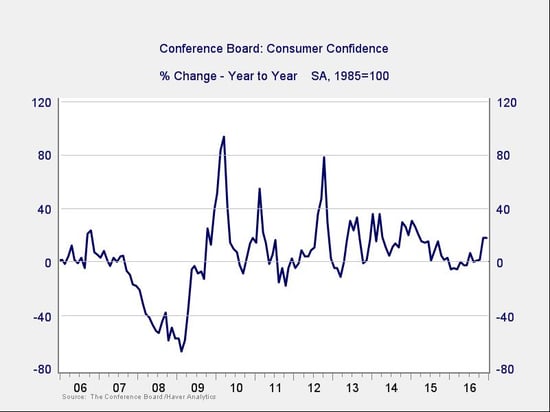
Signal: Green light
Consumer confidence substantially improved again last month, beating expectations by a wide margin and keeping the year-on-year change at very strong levels. With the improvements in the past two months, and especially since the election, the year-on-year change has moved well above zero, taking this indicator away from the trouble zone. With both the improving rate of change and the very strong base confidence level, this indicator is well out of the danger zone and remains a green light.
Conclusion: Economy healthy, positive trends resuming
Business confidence has been very volatile, but the continuation of the prior month’s substantial bounce suggests the move to a higher level may persist, extending the positive trend we've seen over the past several months. Consumers remain very confident on an absolute basis, and there has been substantial improvement recently, suggesting they will continue to support economic growth.
Overall, positive conditions seem likely to continue, and the signal for the economy remains a green light.


