Print
Print My colleague Sam Millette, senior investment research analyst on Commonwealth’s Investment Management and Research team, has helped me put together this month’s Economic Risk Factor Update. Thanks for the assist, Sam!
The economy showed moderate growth in January, despite the lingering headwind of the third wave of the pandemic. There were signs toward month-end that federal stimulus and an improving public health picture started to have a positive impact on the economic recovery, with a return to job growth and increases in business and consumer confidence. Reflecting the improvements, long-term interest rates also began to show signs of normalization.
Overall, despite the improvements, we remain at a red light. But the conditions are now in place for an upgrade in coming months if the pandemic continues to subside.
The Service Sector
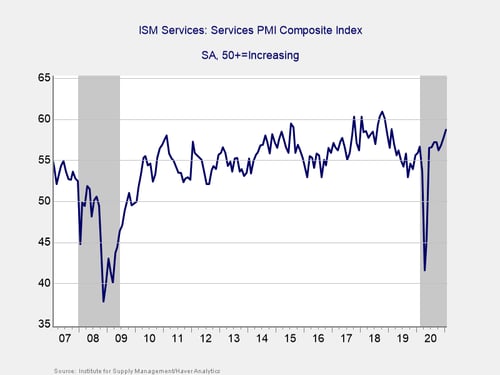
Signal: Green light
This measure of service sector confidence beat expectations during the month, with the index rising from 57.7 in December to 58.7 in January, against calls for a decline to 56.7. This is a diffusion index, where values above 50 indicate expansion, so this result was a welcome sign that service sector businesses continued to successfully adapt to operating during a pandemic. This marks the highest level of service sector confidence since February 2019, highlighting the impressive recovery for business confidence that we’ve seen since initial lockdowns were lifted last year. Manufacturing confidence also held up well. High levels of business confidence have historically been linked with higher levels of business spending, so this is a good sign to start the year.
Given the better-than-expected result and the fact that confidence remains in expansionary territory and above pre-pandemic highs, we have left this signal as a green light for now.
Private Employment: Annual Change
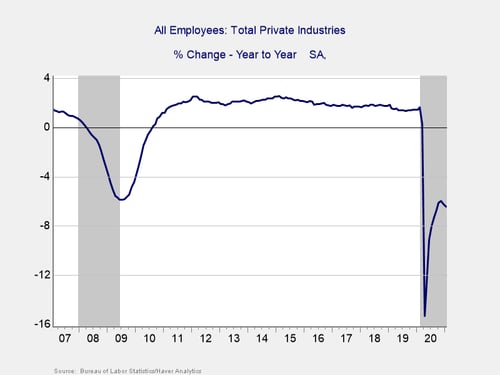
Signal: Red light
January’s employment report showed that the economy added 49,000 jobs during the month, which was below economist estimates for 105,000 new jobs. Despite missing the forecast, this result is a step in the right direction after December’s downwardly revised loss of 227,000 jobs. The return to job growth in January is a positive sign, as it shows that the federal stimulus spending and the diminishing state and local restrictions are starting to spur faster recovery for the job market. The underlying data also showed signs of improvement. The unemployment rate fell by more than expected, declining from 6.7 percent in December to 6.3 percent in January, against forecasts for no change.
Looking forward, continued progress with controlling the third wave of the pandemic should allow local and state governments to lift their restrictions, which could serve as a tailwind for a swift jobs recovery. With the pace of vaccine distribution accelerating across the country, the effects from this anticipated tailwind may start to be felt relatively soon, depending on how well we can manage the public health situation over the coming months. Given the effective efforts to lower case counts in January, we may be poised for an acceleration in job growth sooner rather than later.
While there are reasons to have hope, for the time being, the labor market remains under pressure, as evidenced by the 6.4 percent year-over-year decline in employment we saw in January. Given the continued stress on the labor market, we have left this signal as a red light for now.
Yield Curve (10-Year Minus 3-Month Treasury Rates)
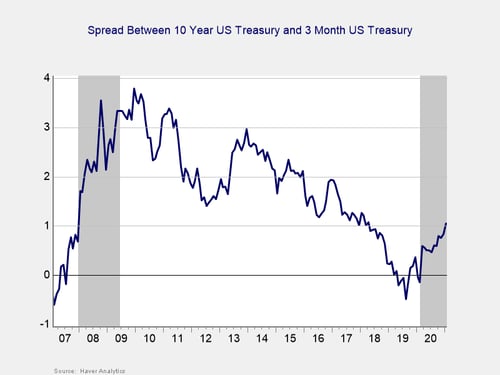
Signal: Yellow light
The yield curve started the year inverted, and it un-inverted in March, where it has remained throughout the pandemic. This un-inversion was initially driven by a sharp drop in short-term rates, caused by the Fed’s decision to cut the federal funds rate to effectively zero percent in March. The 3-month Treasury yield fell modestly to start 2021, from 0.09 percent at the end of December to 0.06 percent at the end of January. The 10-year yield rose during the month, from 0.93 percent at the end of December to 1.11 percent at the end of January, driven in large part by rising expectations for additional federal stimulus spending and faster economic growth. This brought the 10-year yield to its highest month-end level since it ended February 2020 at 1.13 percent. While short-term rates are expected to remain low until at least 2023, longer-term rates have started to approach pre-pandemic levels, reflecting a normalization of expectations for growth.
Although the spread between the 10-year and 3-month Treasury remains near the recession zone, as longer-term rates have normalized, the spread is approaching the level that historically has signaled a recovery. We have therefore changed this signal to yellow for now, and an upgrade to green is possible if long-term rates continue to normalize.
Consumer Confidence: Annual Change
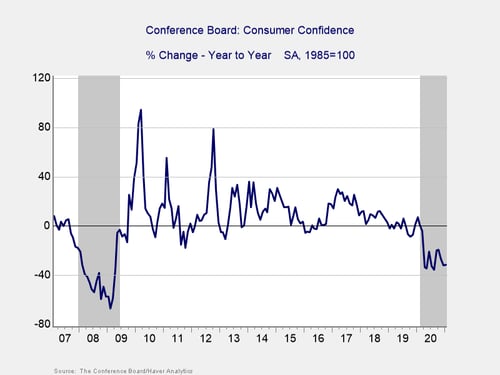
Signal: Red light
Consumer confidence rose by more than expected during the month, from 87.1 in December to 89.3 in January, against forecasts for 89. This result was a step in the right direction after the index hit a four-month low in December. On a year-over-year basis, however, confidence fell by 31.5 percent in January. Although that was a modest improvement from the 32 percent drop we saw in December, confidence declines of 20 percent or more over the past year are typically signals of a recession, which is consistent with the NBER declaration. Given the continued year-over-year weakness, we have left this indicator as a red light for now.
Despite that, however, there are signs that consumers have started to feel the positive impact from the improving public health situation and the federal stimulus that was passed at the end of December. With an improving job market and public health picture, it's possible we will see marked improvements for confidence figures over the next few months. For the time being, however, the large year-over-year decline in confidence is a sign that there is still a lot of work to be done to get back to pre-pandemic levels.
Conclusion: January May Mark a Turning Point
January showed signs that the economic recovery may be poised to accelerate over the coming months, driven in large part by falling case counts and the positive impact from additional federal stimulus spending. With that said, for the time being, growth remains relatively weak, as shown by the year-over-year declines in employment and consumer confidence figures. Despite the weakness on a year-over-year basis, both of these indicators showed improvement in January, which could be a sign of an impending acceleration for the economic recovery.
Overall, the pandemic continued to serve as a headwind for faster economic growth in January; however, the improvements we saw toward month-end point to a potential turnaround, especially if we continue to make progress with the pandemic. Given the continued public health risks and the weakness in year-over-year data, it's too early to say we are out of the woods, but there are signs of light at the end of the tunnel. We have left the risk level at a red light for the economy as a whole in February, but this could change in the near future if we see an accelerating economic recovery.