Print
PrintMy colleague Sam Millette, senior investment research analyst on Commonwealth’s Investment Management and Research team, has helped me put together this month’s Economic Risk Factor Update. Thanks for the assist, Sam!
July saw a continued economic recovery, with many of the economic factors we track in this piece coming in better than expected during the month. This was an encouraging development, as it showed that rising case counts were not enough to derail the economic rebound. Highlights include better-than-expected service sector confidence and a strong July jobs report. Declining consumer confidence was a concerning development, however. Although much of the data released in July was encouraging, there is still a long way to go to get back to pre-pandemic activity levels, and risks to the economic recovery remain.
The Service Sector
Signal: Green light
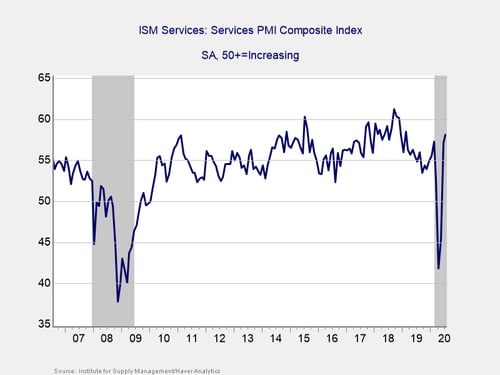
This measure of service sector confidence continued to improve in July, beating economist estimates for the second month in a row. The index rose from 57.1 in June to 58.1 in July, against expectations for a fall to 55. This is a diffusion index, where values above 50 indicate expansion, so this continued improvement was very encouraging. It indicated that service sector confidence held up well despite rising COVID-19 case counts throughout the month. In fact, service sector confidence now sits at its highest level since February 2019, highlighting the positive impact reopening efforts continued to have on business confidence in July.
The service sector accounts for the lion’s share of economic activity, so the rapid recovery in confidence we saw in June was a good sign for the ongoing economic recovery. Given the better-than-expected results in July, we have upgraded this signal to a green light for now.
Private Employment: Annual Change
Signal: Red light
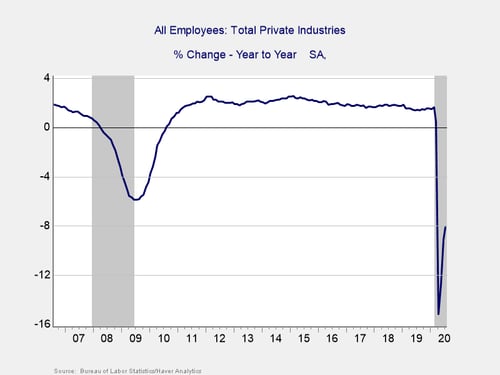
July’s employment report showed 1.76 million jobs added during the month, against economist estimates for 1.48 million additional jobs. This marks three straight months with more than 1 million jobs added. The unemployment rate fell to 10.2 percent in July, down from 11.1 percent in June and better than economist expectations for a more modest decline to 10.6 percent.
This strong report, following June’s better-than-expected result, indicates that the worst is likely behind us. With that being said, the damage caused in March and April still leaves overall employment levels far below where we were a year ago, and we will need several more months with very strong job creation to get back to pre-pandemic levels. Despite the positive results over the past three months, we’re keeping this indicator at a red light for now, given the fact that overall employment levels are still extremely weak on a year-over-year basis.
Private Employment: Monthly Change
Signal: Red light
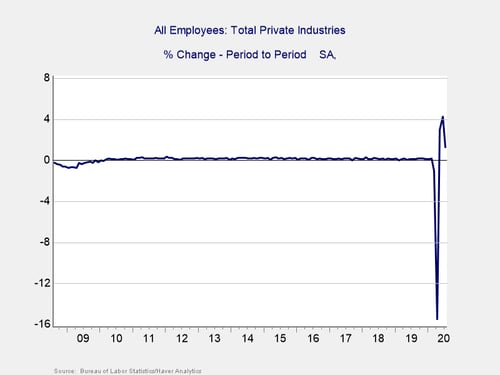
These are the same numbers as in the previous chart but on a month-to-month basis, which can provide a better short-term signal. While July’s better-than-expected report was positive, the data needs to be taken in context, as we lost more than 20 million jobs in April. July also marks the worst month for new jobs since reopening efforts began, indicating that the tailwind from businesses reopening may be starting to fade.
In addition, the unemployment rate of 10.2 percent in July represents the fourth-highest level since World War II, trailing only the record results from April, May, and June. Given the massive disruption to the job market in March and April and the still historically high unemployment rate, we are leaving this indicator at a red light.
Yield Curve (10-Year Minus 3-Month Treasury Rates)
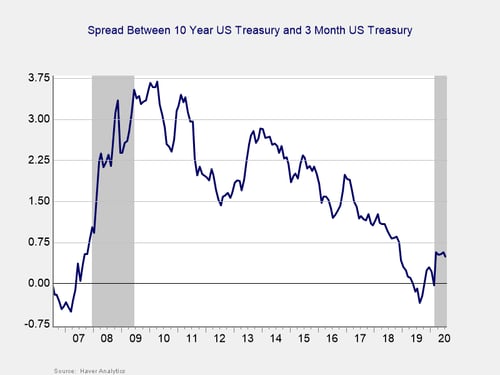
Signal: Red light
The yield curve started the year inverted, and it un-inverted in March, where it has remained throughout the pandemic. This un-inversion was driven by a sharp drop in short-term rates, which was caused by the Fed’s decision to cut the federal funds rate to effectively zero percent in March. The yield of the 3-month Treasury fell in July, from 0.16 percent at the start of the month to 0.09 percent at month-end. The 10-year yield also fell, from 0.66 percent to 0.55 percent.
Although an inversion is a good signal of a pending recession, it is when the gap subsequently approaches 75 bps or more that a recession is likely. We finished June with a spread of 46 bps, and the National Bureau of Economic Research (NBER) declared a recession started in February. In light of that, and with the spread remaining near the critical level, we are leaving this indicator at a red light.
Consumer Confidence: Annual Change
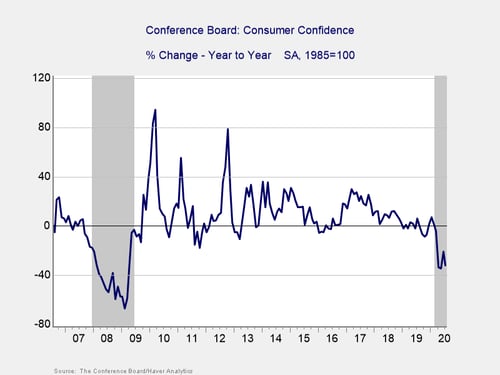
Signal: Red light
Consumer confidence disappointed in July, declining by more than expected during the month. The index fell from 98.3 in June to 92.6 in July, against forecasts for a more modest decline to 95. This drop was caused by falling expectations for future economic growth, as consumers likely saw rising case counts during the month as a headwind for faster growth going forward. The index still sits above the recent low of 85.7 that it hit in April, so this result is an improvement in some respects, but it was still a step in the wrong direction for the month.
This disappointing result brought the year-over-year decline for consumer confidence down to 31 percent. Confidence declines of 20 percent or more over the past year are typically signals of a recession, which is consistent with the NBER declaration. Given the continued weakness on a year-over-year level and disappointing regression in July, we have left this indicator as a red light for now.
Conclusion: Rising case counts not enough to derail recovery
July’s economic data releases largely came in better than expected and helped calm fears of rising case counts halting the economic recovery. We also saw signs during the month that efforts to contain local coronavirus outbreaks in various states were starting to show positive results, which is an encouraging sign. Despite mostly strong economic results, July’s activity levels largely showed a slowdown compared with June, indicating that the boost from reopening efforts may be beginning to fade.
Ultimately, while July showed the economy continuing on the path of recovery after setting an apparent bottom in April, there is still a long way to go to get back to pre-pandemic levels, and setbacks are likely. Given the slowdown in economic activity from June to July and the damage that was caused in April and March, we are leaving the risk level at a red light for the economy as a whole for August.