Print
PrintStarting this week, my colleague Sam Millette, senior investment research analyst on Commonwealth’s Investment Management and Research team, will be helping me with the Economic Risk Factor Update posts. Thanks for the assist, Sam!
The economic data released last month was mixed, with improvements in consumer confidence offset by declining business sentiment. Job creation continued to be solid, but there are signs of a slowdown. The yield curve remains inverted despite the rate cut made at the Fed’s July meeting. Although we are not yet at immediate risk levels, there are certain areas of the economy that should be watched closely going forward.
The Service Sector
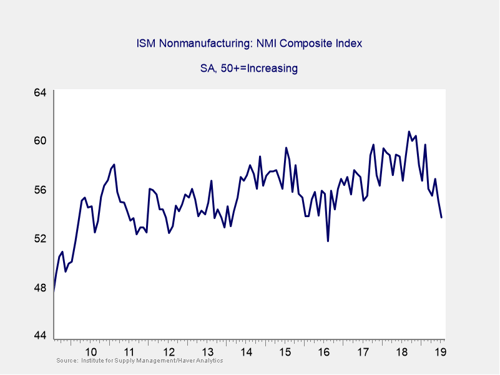
Signal: Yellow light
This survey of confidence for the service sector of the economy fell again last month, as business owners started to feel the effect of slowing global trade. This drop was echoed by similar declines in manufacturer confidence. Although the recent decline brought the index to its lowest level since 2016, any value greater than 50 indicates expansion. So, this indicator remains a yellow light for now.
Private Employment: Annual Change
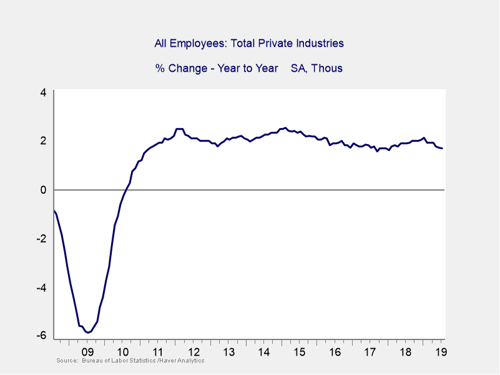
Signal: Green light
July was a solid month for new jobs, as 164,000 were added, in line with expectations. The underlying data was positive as well, with wages growing faster than expected and unemployment remaining low. With that being said, the job growth rate is clearly trending down on a year-over-year basis. Although we are not currently at risk levels, the slowdown in year-over-year growth should be monitored. For now, we’ll keep this indicator as a green light.
Private Employment: Monthly Change
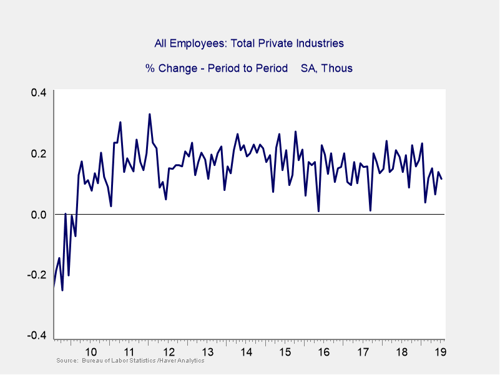
Signal: Yellow light
These are the same numbers as in the previous chart but on a month-to-month basis, which can provide a better short-term signal.
Although July’s results were solid, the monthly job creation rate remains below levels seen in 2018. Combined with the slowing in the year-over-year figures, this decline in the average monthly growth indicates that the overall pace of job growth is slowing. Due to this slowdown, this indicator remains at a yellow light.
Yield Curve (10-Year Minus 3-Month Treasury Rates)
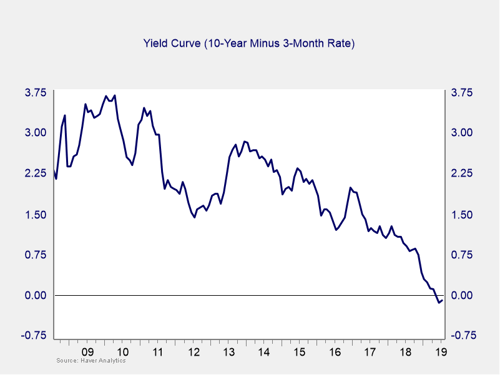
Signal: Yellow light (tending to red)
Despite a 25 bp cut to the federal funds rate at month-end, the yield curve remained inverted in July. Rates on the longer end of the curve remained relatively stationary during the month, but shorter rates fell in anticipation of the rate cut. The 3-month Treasury yield fell from 2.16 percent to 2.07 percent. As the length of the inversion grows, it is getting close to starting a recession countdown. But it is not quite there yet. Given that and the delay between such an inversion and the actual start of a recession, the immediate risk remains low. Recent policy moves and market action suggest risks are rising, however. As such, along with other signs of weakness, the indicator remains something to watch. I am keeping this measure at a yellow light this month.
Consumer Confidence: Annual Change
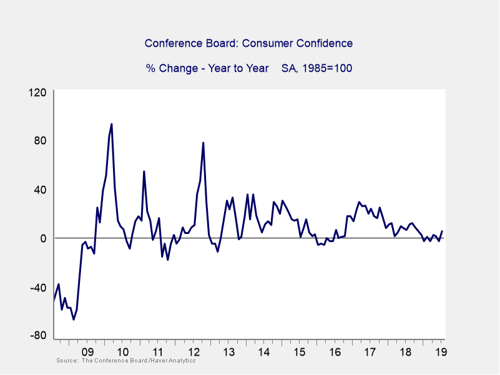
Signal: Yellow light
Following a trade war-driven decline in June, consumer confidence rebounded by more than expected in July. The solid July job growth figures along with equity market outperformance helped support consumer confidence. Despite the strong result in July, confidence growth is still lagging behind the pace we experienced over the past few years. As such, this indicator remains at a yellow light.
Conclusion: Risk remains elevated
All things considered, this was a month that saw risks gradually increasing across a number of important areas of the economy. The decline in business owner optimism and slowdown in job creation indicate the economy is not immune to the effect of slowing global trade. Although the jump in consumer confidence was a welcome surprise, now we’ll have to wait and see if U.S. consumers are willing and able to grow the economy through increased spending.
Although a continued slowdown remains the most likely case based on the data, a slowdown is not a recession—we likely still have several quarters to go there. Nonetheless, the bulk of the data indicates the risks of a worsening slowdown remain material (again, not yet as the base case). As such, I am leaving the overall risk level at a yellow light for the economy as a whole for August.