Print
Print My colleague Sam Millette, senior investment research analyst on Commonwealth’s Investment Management and Research team, has helped me put together this month’s Economic Risk Factor Update. Thanks for the assist, Sam!
The economic recovery continued to pick up steam in March, driven by public health improvements and the federal stimulus checks that reached bank accounts during the month. All of the major indicators we track in this piece showed improvement, with rising service sector and consumer confidence coinciding with faster job growth and a continued normalization of interest rates.
Given these improvements, we’ve kept the economic risk level at yellow—and an upgrade to green is possible in the upcoming months. Although we have made steady progress with the pandemic and are creating the conditions for a return to a more normal economic environment throughout the rest of the year, there is still work to be done to get back to pre-pandemic activity levels.
The Service Sector
Signal: Green light
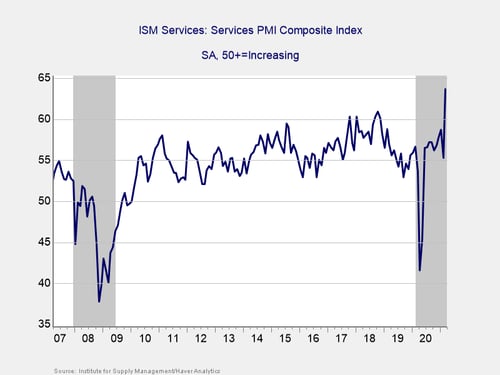
Service sector confidence surged well past economic expectations during the month, rising from 55.3 in February to 63.7 in March against calls for a more modest increase to 59. This better-than-expected result brought the index to its highest level since records began back in 1997. Service sector confidence fell by more than expected in February, driven by the winter storms that affected much of the country throughout that month. The rebound for the index in March is an encouraging sign that the weather-related slump in February was a temporary lull for service sector confidence, rather than the start of a negative trend.
Service sector confidence has rebounded well since initial lockdowns were lifted last year, and this strong result in March signals faster growth ahead. This is a diffusion index, where values above 50 indicate expansion, so March’s record result bodes well for service sector spending and growth. Given the continued progress with vaccination programs throughout the country and the anticipated tailwind from the most recent federal stimulus bill, service sector confidence and spending are expected to remain in expansionary territory over the upcoming months.
Given the rebound in confidence to record levels in March, we have left this indicator as a green light.
Private Employment
Signal: Yellow light
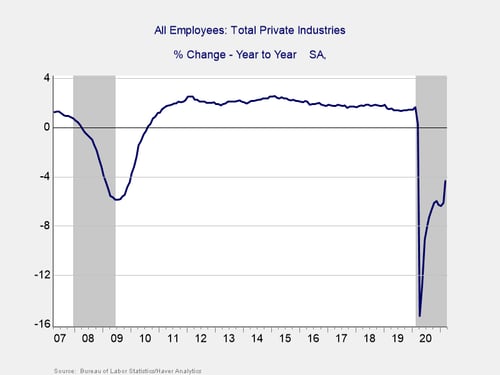
March’s employment report showed that the economy added 916,000 jobs during the month, which was an improvement from the upwardly revised 468,000 jobs that were added in February and above economist estimates for 660,000 additional jobs. This marks three straight months with accelerating job growth to start the year. This strong result was largely driven by the continued easing of state and local restrictions throughout the month that allowed for faster job growth. The unemployment rate also showed improvement, falling from 6.2 percent to 6 percent in March.
Looking forward, further progress in getting Americans vaccinated will likely support continued improvements in the pace of hiring. Although we’ve seen solid progress in the past few months in increasing the rate of new hires, on a year-over-year basis, we are still down by 4.3 percent in terms of total jobs.
There are reasons for hope throughout the rest of the year, but the labor market remains under pressure for the time being, as shown by the continued year-over-year decline in employment in March. Given the accelerated improvement in the pace of hiring, we have upgraded this signal to yellow for now. The year-over-year weakness indicates that the job market is still facing pandemic-related stress, however, and should continue to be closely monitored.
Yield Curve (10-Year Minus 3-Month Treasury Rates)
Signal: Green light
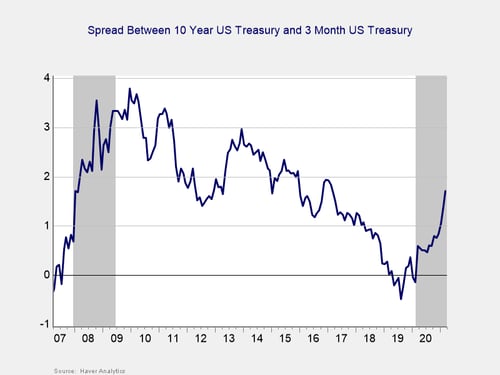
The yield curve continued to widen during the month, primarily driven by rising long-term interest rates. The 3-month Treasury yield fell modestly from 0.04 percent to 0.03 percent during the month. The 10-year increased from 1.44 percent at the end of February to 1.74 percent at the end of March, bringing it to levels last seen in January 2020. While short-term rates are expected to remain low until at least 2023, longer-term rates now sit near pre-pandemic levels, reflecting a normalization of growth expectations as economic conditions continue to improve.
Given the normalization of long-term interest rates and the expectation for short-term rates to remain low, the yield curve should stay near levels that have historically signaled a recovery. Therefore, we have kept this signal at green, reflecting the positive impact from the continued economic recovery on rates.
Consumer Confidence: Annual Change
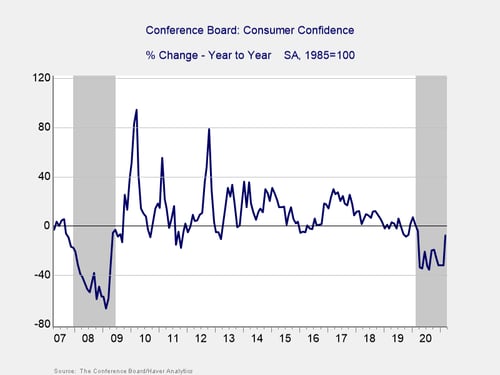
Signal: Yellow light
Consumer confidence came in well above economist forecasts during the month, with the index rising from 90.4 in February to 109.7 in March against calls for a more modest increase to 96.9. This result brought the index to its highest level in a year, and it marks three consecutive months with improved confidence. Consumer confidence has been supported by improvements on the public health front, as well as multiple rounds of federal stimulus payments.
On a year-over-year basis, confidence showed improvement compared with earlier in the pandemic, as March’s 7.7 percent year-over-year decline is the best result for the index since March 2020. This is a marked improvement from the 31.8 percent year-over-year decline we saw in January and February. Historically, confidence declines of 20 percent or more over the past year are signals of a recession, so this is an encouraging development—even if some of the improvement in the year-over-year data was caused by declining confidence levels in March 2020 at the start of the pandemic.
Given the improvement for consumer confidence on both a monthly and year-over-year basis, we have upgraded this indicator to yellow for now. Looking forward, continued progress with vaccinations and the anticipated tailwind from the most recent federal stimulus bill are expected to support continued improvements for consumer confidence and spending.
Conclusion: Signs for Hope as Spring Continues
The data releases in March largely indicated a faster economic recovery, driven by public health improvements and the tailwind from additional stimulus checks reaching bank accounts. The better-than-expected improvements for consumer and business confidence are encouraging signs that the economic expansion might be poised for even faster growth as we head into the spring, especially as we continue to make progress with vaccinations.
With that being said, the economy is still experiencing some of the negative impact from the pandemic a year after initial lockdowns were imposed, as seen by the declines in the year-over-year growth figures we track here. While there are signs for hope, for the time being, the economy is still facing stress from the pandemic and there is uncertainty regarding the path and pace of the recovery throughout the rest of the year.
Given this uncertainty and the continued weakness in some of the year-over-year data, it’s too early to say we are out of the woods, but there are signs of light filtering through the trees. The positive progress in March was encouraging and allowed for upgrades to two of the indicators this month. We have left the overall economic risk indicator at a yellow light for now, with the possibility of an upgrade in the upcoming months if we continue to see improvements.