Print
PrintMy colleague Sam Millette, senior investment research analyst on Commonwealth’s Investment Management and Research team, has helped me put together this month’s Economic Risk Factor Update. Thanks for the assist, Sam!
The economic data releases in March were down significantly, but they have only just started to reflect the new economic reality imposed by the measures needed to combat the coronavirus. While some of the individual reports came in above forecasts, those results were due to sharply lowered expectations rather than real outperformance. Almost all of the economic indicators now sit at a red light level, and the remainder will likely get there in the next month. There is hope for a potentially swift economic recovery once virus-related stay-at-home orders are lifted, but there is no doubt that we are currently experiencing a period of extreme economic stress.
The Service Sector
Signal: Red light
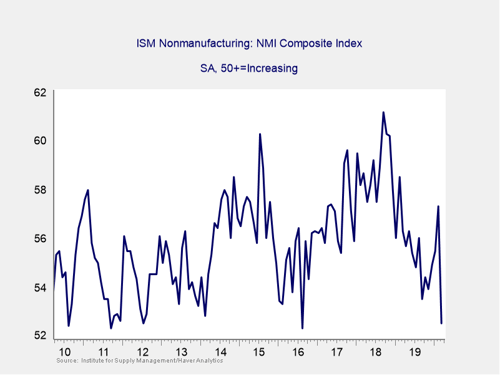
This measure of service sector confidence fell from 57.3 in February to 52.5 in March, which beat expectations for a drop to 43. This is a diffusion index, where values above 50 indicate expansion and values below indicate contraction. So, this result demonstrated surprising resilience from the service sector during the month. Despite this better-than-anticipated result, future surveys are expected to show significantly lower confidence levels, as businesses will be coping with the massive drop in consumer demand created by the government measures to combat the spread of the coronavirus. Given the sharp fall in confidence we saw last month, as well as the likelihood for further declines as businesses continue to deal with the shutdown, we are downgrading this indicator to a red light.
Private Employment: Annual Change
Signal: Red light
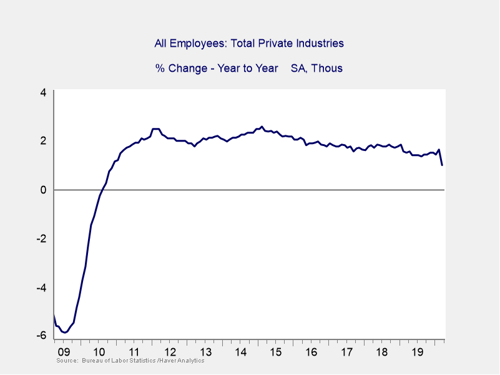
March’s employment report was disappointing, as 701,000 jobs were lost during the month. This was significantly higher than the decline of 100,000 that economists expected. This result marks the first month with a net job loss since 2010, breaking an extraordinary streak of monthly job gains over that period. This disappointing result brought the year-over-year rate of change to its lowest level since November 2010, when we were finally beginning to see the jobs market show signs of a sustained recovery from the great recession. This grim report was made worse by the fact that it undercounts the true damage done to the economy during the month. This report covered only the first two weeks of March, and the pace of layoffs increased dramatically during the second half of the month. April’s employment report is expected to show significantly more job losses and a climbing unemployment rate.
Given the sharp decline in March and the significant decline we'll see in April, we have moved this indicator down to a red light.
Private Employment: Monthly Change
Signal: Red light
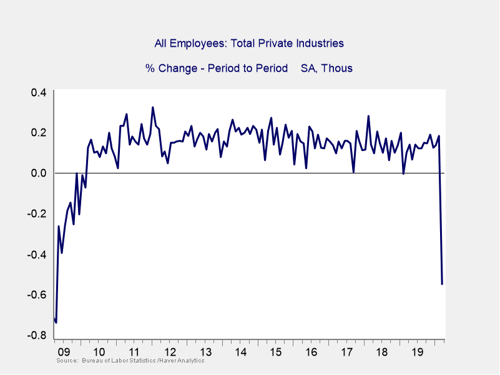
These are the same numbers as in the previous chart but on a month-to-month basis, which can provide a better short-term signal.
The pace of month-over-month job growth dropped sharply in March, falling by the fastest monthly rate since April 2009. The headline jobs figure came in worse than expected, and the underlying data was negative as well. The unemployment rate increased from 3.5 percent in February to 4.4 percent in March, which was worse than economist estimates for a rise to 3.8 percent. These disappointing results indicate that business owners began laying off employees earlier in the month than previously thought. All eyes will be on April’s employment report, where economists expect to see the already booked layoffs from late March and April take the unemployment rate up to 7.7 percent. Given the massive disruption to the job market in March and the anticipated future weakness, we have moved this signal down to a red light.
Yield Curve (10-Year Minus 3-Month Treasury Rates)
Signal: Red light
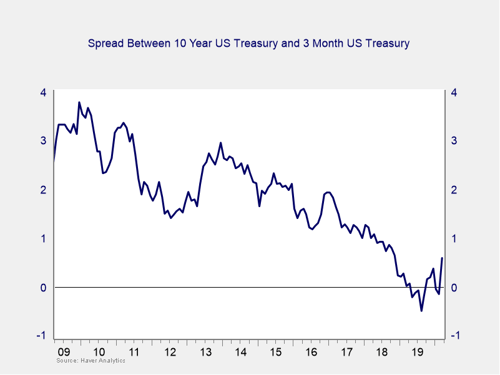
After spending the fourth quarter un-inverted, the yield curve re-inverted in January, remained inverted throughout February, and un-inverted again in March. This un-inversion was driven by a sharp drop in short-term rates, which in turn was caused by the Fed’s decision to cut the federal funds rate to effectively zero percent during the month. The yield on the 3-month Treasury fell from 1.13 percent at the start of the month down to 0.11 percent by month-end. The yield of the 10-year Treasury also fell as investors fled to the relative safety of Treasury bonds; however, this was a more muted drop, falling from 1.10 percent down to 0.70 percent during the month, leaving the gap at 59 bps.
While an inversion is a good signal of a pending recession, it is when the gap subsequently widens to 75 bps or more that a recession becomes imminent—and that is what has just about happened. With the spread continuing to widen and approaching the critical level, we are taking this indicator to a red light. In conjunction with other monetary and fiscal policy actions, the widening clearly indicates rising risk.
Consumer Confidence: Annual Change
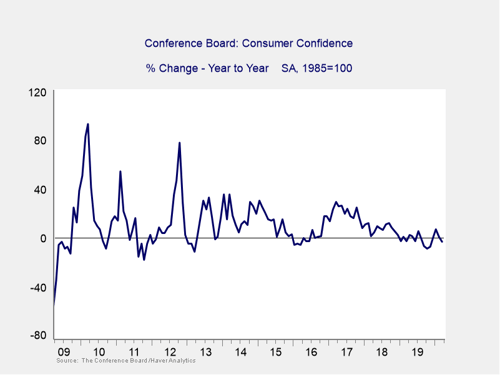
Signal: Yellow light
Consumer confidence fell from an upwardly revised 132.6 in February to 120 in March. This result, which beat expectations for a decline to 110, brought the index to its lowest level since July 2017. On a year-over-year basis, the index fell by 3.4 percent in March. The subindex measuring consumer concerns about the future cratered from 108.1 in February to 88.2 in March. The measure of current conditions experienced a much smaller decline, from 169.3 in February to 167.7 in March. The surprising strength in the present-situation index indicates that there is still plenty of room for this headline figure to fall in upcoming months. Consumer confidence will be a key economic indicator going forward, given the relationship between confidence and spending.
While the decline in March was disappointing, we’re leaving this indicator at a yellow for now due to the better-than-expected result, but a downgrade to red is likely if we see further declines in April. Indeed, such downgrades are very likely, as the University of Michigan survey just showed a significant decrease.
Conclusion: Recession either underway or coming shortly
While some of the March releases came in better than expected, those results did not take into account the most recent—and much worse—data. The overall picture is of an economy that is turning down sharply from the headwinds created by the current anti-coronavirus measures. This is a swift change from the first two months of the year, where we saw largely improving economic data. These earlier results have helped cushion some of the recent fall. For example, the sharp drop in the nonmanufacturing index would look even worse if it had come from a lower base and brought the index down below 50. Nonetheless, the downturn is now underway.
Ultimately, this was a month that showed quite clearly the impact that a large external shock can have on the economy. Both on a monthly and year-over-year basis, the reports point toward an economy that stands on the brink of recession, if it’s not already there. Given the weakening economic fundamentals during the month and the anticipation of further pressure from the measures to combat the coronavirus, we are bringing the overall risk level to a red light for the economy as a whole for April.