Print
PrintIn March, many of the economic indicators we track experienced slight pullbacks. Given recent positive trends—and the fact that most of the metrics remain in healthy territory—I’m not that concerned. Although the weakness is certainly worth monitoring in case it becomes the start of a larger trend, all of our indicators remain in the green-light zone.
The Service Sector
Signal: Green light
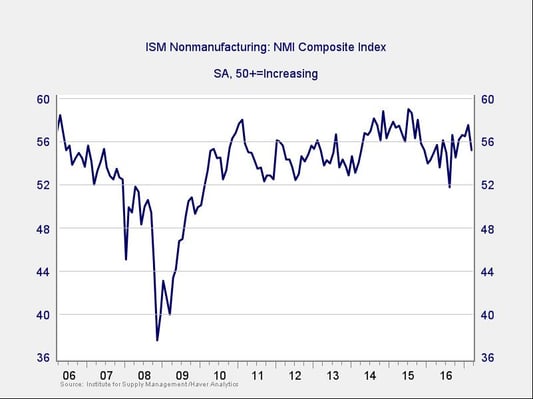
The ISM Nonmanufacturing Index decreased in March, dropping to 2016 levels. Although the pullback was a surprise, the index remains in healthy expansionary territory, indicating that businesses are generally optimistic. As you can see in the chart above, drops like this are not unusual and don’t necessarily indicate a change in trend, but this metric will bear watching over the next couple of months.
Given the generally positive trend and other good news, this indicator remains a green light.
Private Employment: Annual Change
Signal: Green light
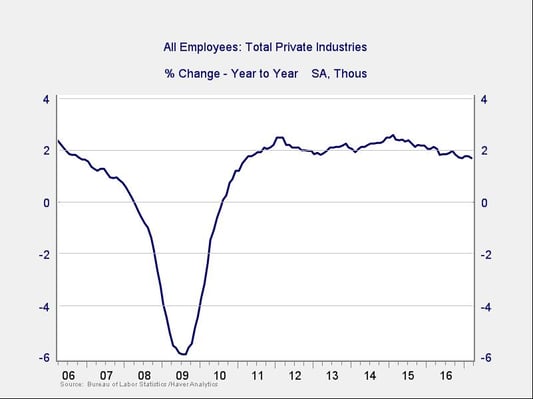
March job creation came in well below expectations, as unseasonably cold weather in much of the country dampened hiring, especially compared with the faster pace in previous months (also likely due to weather). I’ll discuss this more on Monday, but for the moment, it’s worth noting that the details of the report are much less concerning than the headline figure would suggest. In any event, even taking the weak result at face value, the slow decline in job growth is consistent with the current stage of the economic cycle, and not indicative of immediate trouble.
Because this is an annual figure, the changes are slower and smaller than those we see in more frequently reported data. This indicator remains a green light, although the weak monthly data and continued decay are starting to give it a more yellowish tint.
Private Employment: Monthly Change
Signal: Green light
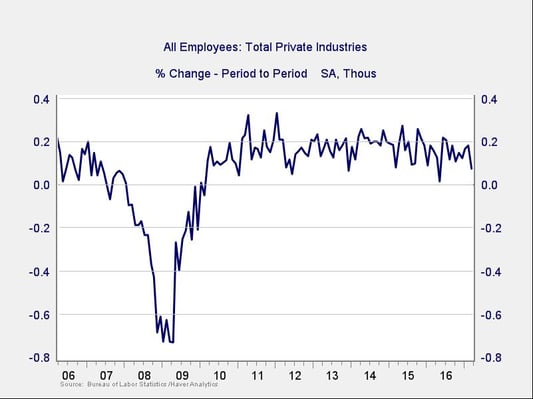
These are the same numbers as in the previous chart, but on a month-to-month basis, which can provide a better short-term signal. March’s headline job growth was disappointing, but the underlying data provided better news. The unemployment rate fell to 4.5 percent on stronger job growth in the household survey. Additionally, average hourly earnings growth remained at healthy levels on a year-over-year basis, as did the workweek. Chances are, this is a weather-related outlier, which we see occasionally.
Although the monthly data may be starting to weaken, that is consistent with the late stage of the employment cycle and probably not a cause for concern in the short term, particularly given the last two strong reports. We’ll keep this indicator at a green light.
Yield Curve (10-Year Minus 3-Month Treasury Rates)
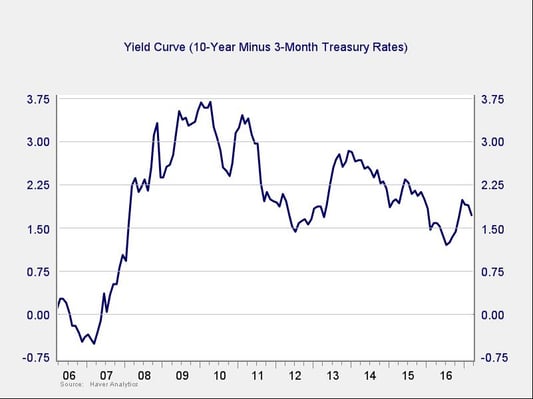
Signal: Green light
The yield curve flattened slightly during the month, primarily due to increases on the short end of the curve. The Federal Reserve increased the federal funds rate by 25 basis points, as expected. Economists expect two more interest rate hikes this year, which would signal the Fed's belief in the strength of the U.S. economy.
The spread between the 10-year and 3-month rates remains far outside of the risk zone and shows that this indicator is still a green light.
Consumer Confidence: Annual Change
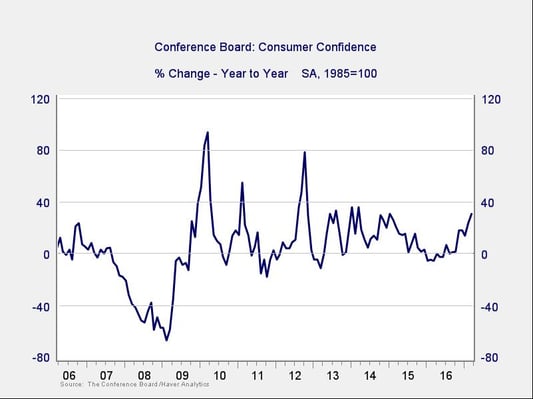
Signal: Green light
Consumer confidence increased again this month, to levels not seen since December 2000. The year-over-year growth rate also rose and sits well above the trouble zone. The continued strength in consumer confidence is a positive sign for the economy and supports continued growth.
Conclusion: Economy healthy, positive trends improve
Continued high levels of consumer and business confidence bode well for future growth. Although the March employment report was weaker than expected, the strength of previous months, combined with the one-time negative impact of the weather, helps mitigate some of the immediate concern.
We will continue to monitor the situation, but it’s possible that the pullback is just a temporary pause before growth returns in earnest. Other factors remain promising as well, with no signs of immediate trouble, although business confidence bears watching.
Overall, positive trends seem likely to continue, and the signal for the economy remains a green light.