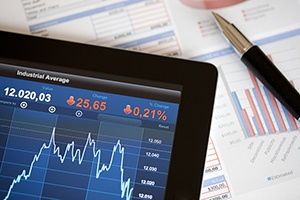
 Over the past two days, we have had the first sell-off in quite a while. With the Dow falling more than 500 points, is it time to stock up on canned goods and supplies? I don’t think so.
Putting the decline in context
Yes, 500 points sounds like a lot. The 1987 crash, in fact, was just upwards of 500 points, so it must be as bad as that? No. In percentage terms, the 1987 crash was almost 23 percent, while the past two days saw a loss of just more than 2 percent. A big difference. Also, in 1987 the crash knocked the market back to levels of a year ago, while the past couple of days took the market to levels of about a week ago. Any way you look at it, the past two days were not fun, but they certainly were not unusual or significant in market history.
The return of real volatility?
What makes the recent pullback alarming is not that it is a big one but that nothing like this has happened for some time. As investors, we have gotten used to a calm market. Any volatility—and the past couple of days do qualify—comes as a shock. It seems worse than it is, but it provides a good opportunity to think about what the return of real volatility, or even a correction, would look like.
If losing 2 percent off the top feels this bad, think about what losing 10 percent (or more) would feel like. We last saw a pullback like that two years ago, in early 2016, when the Dow was down more than 10 percent. It hurt and made people question their investment allocations. There was a very real fear that it was the big one and that the market was headed down even farther. People then, like perhaps now, were very worried.
Tracking the warning signals
It didn’t work out like that, of course, and the why of that is interesting. Deep, sustained market downturns are associated with recessions. Recessions, in turn, have several warning signs, which we track monthly in the economic risk factor and market risk updates. Back then, none of those signals were flashing red, and so it was unlikely that the correction would turn into something worse. In fact, the market bounced back hard to where we find ourselves today. The signals worked.
The signals are likely to work today as well. While there is more yellow right now, the majority of the signals remain green for both the economy and the market. The conditions for a sustained pullback simply are not in place—and don’t look likely to show up any time soon.
Is this a good thing?
Of course, that doesn’t mean we couldn’t see the market pull back more, as 2016 also tells us. A pullback of 5 percent, 10 percent, or even more would be perfectly normal volatility, even as the market continues to rise overall. The recent calmness is unusual and, frankly, a bit worrying. Markets should be somewhat volatile, as investors go back and forth. While no one welcomes a pullback, it often provides the foundation for future gains. In that sense, the recent drop is actually a good thing.
With the economy continuing to grow, and with corporate earnings rising due to both natural growth and the effects of the tax bill, the foundation of the market looks solid, and any pullback is likely to be short lived. There will be a time to worry, but it is probably not now.
Keep calm and carry on.


 Print
Print

