 With the Dow cracking 21,000 yesterday, just over a month after breaking 20,000—and other indices setting records as well—there are a few questions we need to ask.
- First, how long can the rally last? Is the market bound to come back down as fast as it went up, or can it keep climbing?
- And second, how high can it go? Even if the rally continues, it will presumably hit an upper limit at some point. Do we have any idea where that might be?
This could go on for a while . . .
Given the market’s strong performance since the election—and the tendency of markets to keep going in one direction (until they don’t)—I expect that the rally is likely to continue. A couple of key factors support that idea.
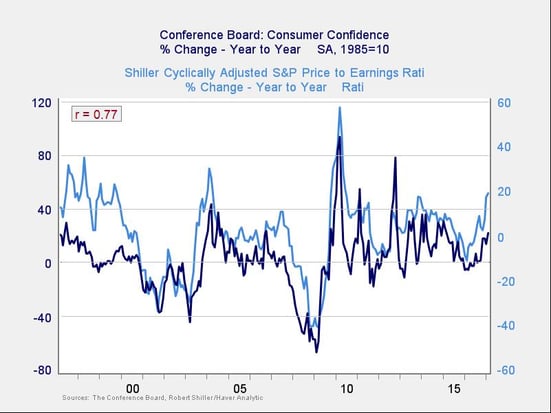
Improving consumer confidence usually drives more expensive stock markets. As you can see in the chart below, changes in consumer confidence track very closely with changes in stock market valuations. With consumer confidence spiking recently, a rise in valuations is both reasonable and likely to continue until confidence rolls over.

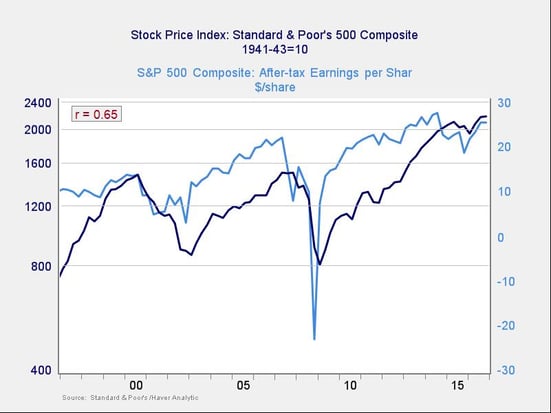
Improving fundamentals drive more expensive stock markets. Here again, we can see a strong correlation between growth in earnings and the stock market. Considering recent earnings growth, which is expected to accelerate, more appreciation in the stock market is not only possible but reasonable.

Where is the next ceiling?
If we can expect the rally to continue for at least a while, how far can it go?
There are two primary ways to evaluate upside limitations. Looking at previous highs, which often act as a ceiling, simply doesn’t apply, as indices are already at all-time highs. In other words, from a technical perspective, there is no ceiling above us. Since we’re in uncharted waters, the second way to evaluate the situation is to look at history.
Here, we run into the challenge of deciding how to measure the market. The typical method is to use price to earnings, or P/E, ratios as a gauge. Shorter-term P/Es, based on one year of earnings, typically either overshoot or undershoot depending on whether the year in question is a bad one or a good one. Forward P/Es, which are based on the next year’s earnings, have that problem, as well as the issue that estimated earnings are just that (not real data).
I prefer to look at the cyclically adjusted P/E ratio, known as the Shiller P/E after the economist who popularized it, which uses average earnings over the past ten years. The idea is that a ten-year period captures both good and bad times and, as an average, is a much better indicator of how the next ten years might look. No measure is flawless, but in my judgment, this is one of the best for our purposes.
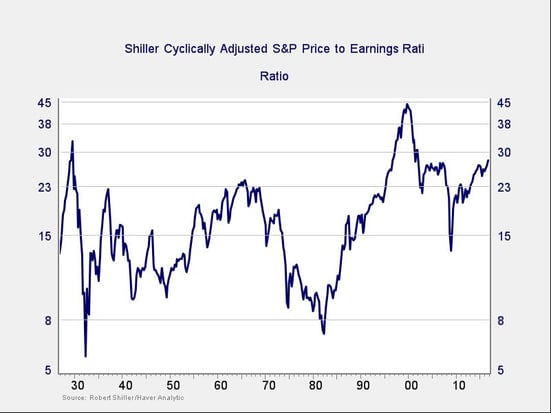
When we look at the Shiller P/E for the S&P 500, we see a couple of things. First—and unlike the indices themselves—it is not at all-time highs. That gives us a measure we can use to help determine an upward limit.

Less reassuringly, that upward limit (above where the market is right now) has only two data points: 32.56 (in 1929) and 44.20 (in 1999). The current level, at 27.93, is above every other point except those two. Market valuations of 27.42 in 2007 came close, but we are now past them.
Two takeaways
Stocks could have quite a bit of upside left. If markets were to match the 1999 valuation, they could appreciate almost another 60 percent, which would take the Dow to over 30,000 and the S&P 500 to over 3,500. Were markets to move up “only” to 1929 levels, we could see an increase of about 16 percent, leaving the Dow at over 24,000 and the S&P 500 at over 2,700. These are the next limits, and the only real technical ones, for the markets.
Very high valuation levels have historically led to high risk levels once the exuberance subsides. In a recent post, I wrote about the returns we can expect in the next few years, noting that high prices tend to mean lower future returns. The more prices rise, the worse future returns can be. This is why the 1929 and 1999 comparisons are concerning. In those cases, we definitely saw lower future returns after the run-up, and the future might well be the same from here.
In the short run, there’s no reason markets can’t keep going, and we should enjoy the ride. It may end up being even better than we now think. The faster and higher we go, however, the more damaging any pullback could be. Keep that in mind as you celebrate the new records.


 Print
Print


