

 Print
Print We left off yesterday with the conclusion that the price you pay for an investment can determine your returns over time. It's a commonsense principle: other things being equal, someone who pays more for an investment will, over time, do less well than someone who pays less. In fact, that’s the core of the classic Wall Street maxim “buy low and sell high.” (Note that buy low comes first.)
Theoretically, this appears to be an obvious conclusion, but theory doesn’t always work out the way you might expect in the financial markets. As we saw in past bubbles (notably 2000 and 2007), prices can go up for years even if the expected returns keep dropping. Prices start out at reasonable levels but then get bid up on increasingly optimistic expectations, only to correct once again to levels that make financial sense.
Over shorter time frames, valuations may not be good indicators of future returns. But are they over longer time periods, and if so, how long does that period have to be?
The Shiller P/E and returns over time
To answer that question, we'll see how this plays out in real life by looking at actual returns from different price levels.
The chart below, taken from a 2011 article of mine, looks at results for the S&P 500 (a reasonable proxy for the stock market as a whole), with the cyclically adjusted price/earnings ratio as the measure of the initial price paid. Commonly known as the Shiller P/E, after the economist who popularized it, this metric is based on average earnings over ten years, rather than one year. The idea is that a long-term average is a better gauge of real valuation than one year, which might be unusually good or bad. The basic principle, however, is the same—a higher P/E means a more expensive price.
We would expect to see that, overall and over time, future returns are lower as the initial purchase price increases.
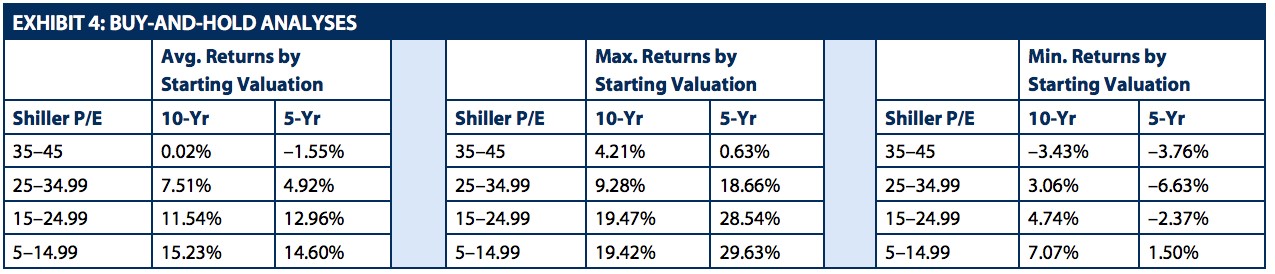
And that’s exactly what we do see: buying at lower prices (the lower Shiller P/Es in the chart) yields higher returns over time. The result is consistent for all valuation levels, for both holding periods examined, and for both maximum and minimum returns. Clearly, initial valuations do have predictive power, at least on a relative basis, for future returns over five to ten years.
How does this apply to stock investments today?
With the Shiller P/E currently at 28.66, according to Robert Shiller’s website, we know a couple of things:
- The market is at the second-highest price range shown in the chart, which sounds scary.
- On the other hand, the average return for the S&P 500 over the next ten years from this price level has been 7.51 percent per year, which doesn’t seem so bad.
- Looking at the next sections of the chart, however, we see that the 7.51 percent average ranges over ten years between 9.28 percent and 3.06 percent, a big gap.
- Worse, at the five-year time frame, returns ranged between 18.66 percent per year, which came from a bull market, and a loss per year of 6.63 percent, from a bear market.
Because these ranges are so substantial, they're not much help in forecasting the returns we can expect from our own portfolios over the long term. We have, however, narrowed down the problem, identifying a range (albeit a big one) for the stock portion of a portfolio.
This is a good first step, but we also need to consider the bond part of a portfolio. Beyond that, if the range we come up with is still too wide, we then need to consider ways of potentially reducing it. We’ll talk about all that next week.


