

 Print
Print My last blog was titled “A Start to Remember for the Markets”—and it’s a story that continues to play out as we move further into 2024. With March’s closing price, the S&P 500 is now up 10.16 percent on the year. Today, we’ll look at a few different aspects of the S&P 500, including its 2024 Q1 return and its five-month return, as well as the relative strength index.
A Notable Q1 Return
The 2024 Q1 return came in above 10 percent, marking just the third time since 1957 that the S&P 500 saw a Q4 return and the following Q1 return both finish up in double-digit percentages. Considering this is a very small sample size, it’s worth taking an in-depth look at its strong Q1 return.
Since 1957, the S&P 500 has posted a Q1 return greater than 10 percent only 12 times, including 2024. The other 11 instances generated a median return of 8.19 percent over the following nine months, with only one of the prior 11 instances seeing a negative nine-month return.
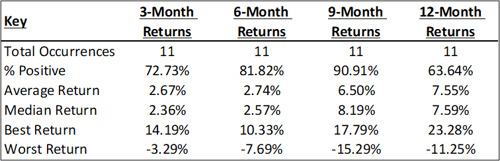
Source: Data from Tradingview. The table reflects index price returns excluding dividends. Past performance is no guarantee of future results.
An Impressive Five-Month Run
Since the S&P 500’s October 2023 closing price, the index has galloped 25.29 percent, marking the 10th time that the S&P 500 has run more than 25 percent over a five-month period. Here, we should note two recurring themes I’ve covered in my recent blog posts:
- Strong returns historically tend to lead to more strong returns, especially strong returns preceding down periods in the markets.
- Momentum in the markets can go on for quite some time, which is why we often hear “don’t fight the trend” when it comes to the markets.
Below is the return data for those nine prior instances.
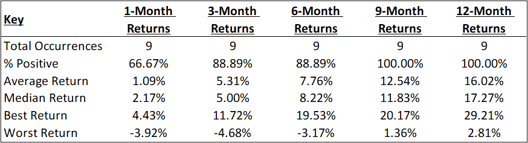
Source: Data from Tradingview. The table reflects index price returns excluding dividends. Past performance is no guarantee of future results.
What the Relative Strength Index Tells Us
According to Investopedia, when the relative strength index (RSI) is greater than 70, this indicates an “overbought” situation. When the RSI is less than 30, this indicates an “oversold” situation. As of last Thursday (the end of March), the S&P 500 is up 27.86 percent over the last 12 months. One may be led to believe that it is possible that the S&P 500’s monthly RSI reading would have eclipsed 70 (and gone into oversold territory) at some point during this exciting run. But not once over those 12 months did the S&P 500 see its monthly RSI reading break into 70+ territory. Dating back to 1957, there have been 51 other times when the S&P 500 has advanced more than 20 percent while not seeing the monthly RSI eclipse 70.
February 2024 and December 2023 also met these criteria, so we are going to exclude those times when we analyze the preceding returns. That leaves us with 49 other instances. In the short term, as you can see below, the one-month returns tend to be a bit more volatile. But looking out over a longer timeframe, the returns improve.
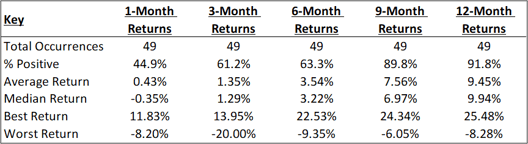
Source: Data from Tradingview. The table reflects index price returns excluding dividends. Past performance is no guarantee of future results.
Will the Momentum Continue?
The S&P 500 continues to find momentum three months into 2024, and historical similarities indicate a potential persistence in this trend. But, as always, historical price returns are far from a guarantee of future price returns.


