

 Print
Print In my last blog, I talked about how strong Januarys historically tend to lead to strong returns throughout the remainder of the year. But I also noted there could be a bit of volatility in February. To my surprise, this turned out to be one of the better Februarys the S&P 500 has ever had, finishing the month up 5.17 percent.
While I may seem like a broken record with my consistently optimistic historical analyses, please know my perspectives are data-driven. Should the data suggest a shift toward a less favorable outlook? My viewpoints will evolve accordingly.
2024 Coming in Hot
With a strong February now behind us, the S&P 500 is up 6.84 percent through the first two months of 2024. This marks the 20th time since 1957 when the S&P 500 was up more than 5 percent through the first two months of the year. Of those prior 19 occurrences, 17 generated positive returns over the final 10 months of the year and 12 saw double-digit returns to finish off the year.
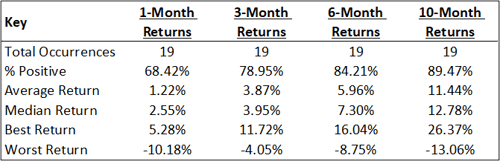
Source: Data from Tradingview. The table reflects index price returns excluding dividends. Past performance is no guarantee of future results.
Strong February Returns
Since 1957, including February 2024, we now have 68 Februarys under the belt. Including this month, only 36 (52.94 percent) of those have had a positive return. Of those 35 other years that saw February post a positive return, more than 80 percent saw a positive return over the next 10 months into year-end.
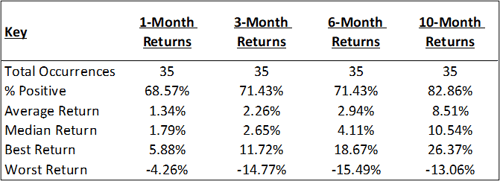
Source: Data from Tradingview. The table reflects index price returns excluding dividends. Past performance is no guarantee of future results.
Even more impressive, since 1957, this was only the seventh year where the S&P 500 posted a return greater than 5 percent during February and only the fifth year where the S&P 500 is up more than 5 percent through the first two months of the year and posted a February return greater than 5 percent. The average 12-month return of those other four years? 19.47 percent.
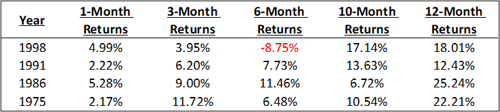
Source: Data from Tradingview. The table reflects index price returns excluding dividends. Past performance is no guarantee of future results.
Historic Run Since October
The S&P 500 might be off to a hot start in 2024, but the run it has had over the past four months is a historic one. With February coming to an end, the S&P 500 is up 21.5 percent since its October 2023 close price. Since 1957, the index has returned more than 20 percent over a four-month timeframe only 14 other times, with the last coming in the summer of 2020. Twelve of those other 14 occurrences saw a double-digit return over the next 12 months, with the worst return being a positive 1.16 percent return.
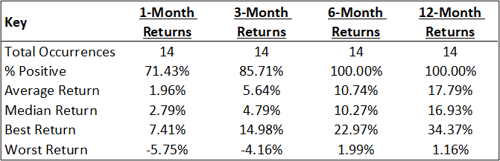
Source: Data from Tradingview. The table reflects index price returns excluding dividends. Past performance is no guarantee of future results.
Long-Term Matters
I usually mention how, in the short term, volatility could exist. But the more I think about it, does it matter? The long-term conclusions from all the data and research I have done point to higher prices. When it comes to the markets, that is what matters. Of course (and as always), historical price returns are far from a guarantee of future price returns.
All indices are unmanaged, and investors cannot actually invest directly into an index. Unlike investments, indices do not incur management fees, charges, or expenses. Past performance does not guarantee future results.


