

 Print
Print One of the questions I have been getting recently is about consumer confidence. Some headlines are saying it is at all-time lows, while others (including me) are saying it isn’t bad at all. Since how people feel obviously affects how much they spend and, therefore, the economy, this is a big and meaningful difference. So, what is going on?
In fact, both assertions are correct, depending on which survey you are looking at because there are two: one from the Conference Board (a private organization) and the other from the University of Michigan. The chart below shows both from the late 1970s to the present, with recession shown as shaded areas.
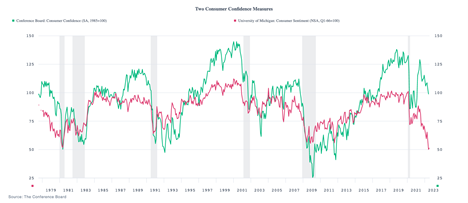
Looking at the two series, they generally track each other. But the most recent data is indeed unusual, with the largest spread between them in the past 40+ years. The Michigan survey is at all-time lows, below even the level of the 2008 financial crisis; the Conference Board number is still around 2015 levels and close to the typical highest levels prior to 2017. Why the discrepancy?
An Unusual Disconnect?
In theory, there shouldn’t be one. Both are survey-based, and while the confidence survey is larger, the Michigan sentiment survey has more detailed questions. The surveys are done at different times of the month, which may result in occasional differences when things are changing quickly, but over time shouldn’t make much of a difference. Indeed, most of the time the two are quite close, although the confidence measure tends to be significantly more variable. But that just makes the current disconnect even more unusual.
In practice, though, there are a couple of reported tendencies. The confidence number tends to be more oriented toward the job market from a worker’s perspective, while the Michigan number tends to focus more on things that affect business conditions, especially for the smaller business owner. Taken at face value, that could well explain the disconnect. Confidence for workers remains high as hiring is strong and there are lots of jobs available. On the other side, sentiment for business owners is hurting because they can’t hire people and their costs are going up with inflation. One group still feels pretty good, and the other not so much. That would explain the discrepancy.
It is also consistent with history. When the gap has been large before, with confidence higher than sentiment, it has been when the job market was quite strong, as in the late 1980s, 1990s and mid-2000s, as well as from 2015–2019. The other gap was in the late 1970s when inflation was high. Combine the two, as now, and history certainly suggests a large gap with confidence higher, which is what we see. Conversely, when the labor market is weak, as in the aftermath of recessions, we should expect the Michigan number to be higher—which, looking at the chart, is often what has happened.
The Recession Risk
This analysis also gives us a clue about what the dueling indicators mean today. The high confidence number means workers still feel pretty good, and as the job market is strong they will have money to spend. Since this is the largest sector of the economy, this is an argument against recession. Although sentiment is low, that seems to reflect costs and the tight labor market, rather than economic weakness. Businesses may be worried, but looking at other data they are still both hiring and investing, despite the worries. That means that between the two, the recession risks are still fairly low.
Note, however, that even with the confidence index still healthy, we have seen a substantial decline and one that takes us into risky territory as we discussed in the Economic Risk Factor Update earlier this month. The risks are indeed rising, and we will likely get a recession at some point—but not immediately.
A Tale of Two Surveys
The final point here, or perhaps it should have been the first point, is to apply some common sense. Are conditions really worse today than they were at the depths of the financial crisis in 2008? The Michigan sentiment survey says they are, but nothing else does. There are real concerns and risks, but we are still in much better shape than we were then. So for my analysis, I am going with the Conference Board confidence index—which is still doing quite well.


