

 Print
Print Yesterday was a rough one for financial markets across the board. China’s markets dropped again, U.S. markets fell in sympathy, and the New York Stock Exchange shut down with technology problems. It’s the end of the world as we know it!
Or maybe not. Although there are reasons for concern, U.S. investors shouldn’t be too worried—as long as they’ve planned ahead for an eventual downturn.
S&P 500 breaks 200-day average
What I find most concerning, here in the U.S., is that the S&P 500 closed yesterday at 2,047 (rounded), below my personal worry point of 2,056, the 200-day moving average. When that happens, I start to pay attention, as the risk level for future declines rises substantially.
Note, however, that risk is not the same as certainty. As you can see in the chart below, the last three times that the S&P 500 has dropped below the 200-day line, it bounced right back up again.
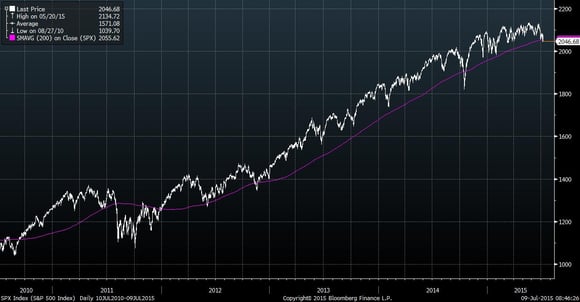
In the past five years, we’ve seen five drops below the 200-day average. Although the last three were inconsequential, the declines in 2010 and 2011 were large enough to be meaningful. Even so, that’s a 60-percent failure rate as a predictor of doom.
Chances are good that this will be another bad call for the 200-day average. Futures this morning are up, and as I’ve noted, basic economic conditions remain supportive.
What’s your plan for a market correction?
What makes the 200-day average worth watching, of course, is the times it doesn’t fail. Hurricane warnings are a good comparison. They’re often wrong, but when they do get it right, it makes up for all the false alarms.
Yesterday’s drop is a good reminder to be sure you’ve thought through your plan for a market correction. What will you do if the market falls 10 percent? What about 20 percent, 30 percent, or more? I’m not saying this will happen, but as we’ve seen over and over again, it’s possible. The Chinese are learning that now.
Using the 200-day moving average again as an example, we know that, historically, trying to trade on the day the average breaks is a bad idea. You get much better results by adding another filter to screen out some false signals. Two secondary filters that tend to work are simply waiting until the end of the month, or waiting for another 5-percent decline, and then acting. Historically, these methods have done a good job of screening out false signals while allowing investors to act in a timely fashion.
Whether you use techniques like these, simply choose to ride out any market downturn, or something in between, what matters is that you have a plan in place for the inevitable downturn that will come someday.
That day, however, might not be any time soon.
U.S. markets remain well supported
Looking at everything that happened yesterday—between the Greek crisis, the Chinese market crash, and the NYSE shutdown—the pullback we saw was actually kind of minor. If you consider the generally, albeit slowly, improving economy here in the U.S., earnings are more likely to outperform expectations than underperform. On top of that:
- The Fed remains very supportive of asset prices here.
- Other central banks continue to provide stimulus.
- Investors in other countries have now seen, once again, that the U.S. is a safe destination.
In short, many factors continue to support the U.S. markets.
Although yesterday's drop caught my attention, I’m not very worried. I expect a recovery, but I also have a plan to act on if it doesn’t materialize.


