 As I mentioned yesterday and in my monthly Market Thoughts video, I’m worried about Greece, but in many ways, I’m more concerned about China. We know about China’s slowing economy and the need to transition from infrastructure- and export-led growth to consumer-driven growth, but these are long-term trends and were basically going well.
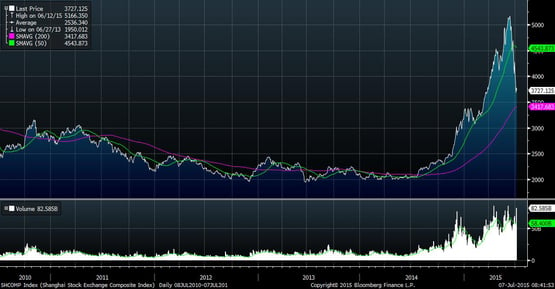
What’s new—and worrying—is the boom and subsequent plunge in the Chinese stock market. You can see both in the following chart.

First off, there are a few important points to note:
- The Chinese market is up significantly year-on-year and remains higher than all of the previous five years, with the exception of recent months.
- The market is still above the 200-day moving average (the pink line in the chart).
- The rapid increase in 2014 and 2015 comes after several years of very weak performance. Arguably, that increase has been a reasonable catch-up, and the recent drop has just been a correction in an ongoing bull market.
A normal correction?
It doesn’t seem like one—particularly given the Chinese government’s reaction to the pullback, which was to pull out all the stops. Interest rates were cut and bank reserve requirements reduced (a combination not seen since the 2008 financial crisis), but the market continued to decline. Last weekend, the government suspended new listings, and 21 brokerages agreed to finance a $19 billion fund to buy stocks and stabilize the markets.
The government and the brokerage firms are clearly very concerned. But despite these measures and a small recovery yesterday, the market continues to decline today.
The disconnect between slowing economic growth and booming markets suggests China is right to worry. One of its big problems, on a corporate level, is debt overhang. The hope was that a rising stock market would allow companies to sell shares to pay off excessive debt—a hope that looks very questionable now. Even worse, many of the investors who are bearing the brunt of the recent decline are new to the market. Chinese investors have historically focused on real estate, but the recent weakness there led many to move their money to the stock market, which they’re now regretting.
What might the damage look like?
The consequences of a collapse would be twofold: first, a loss of confidence in the market and the regulators; second, a loss of wealth and purchasing power.
For an economy attempting to transition to consumer growth, the loss of almost $3 trillion in paper wealth since May is significant. With savers facing slower growth or actual losses in both real estate and the stock market, the average person’s ability to build wealth will likely be substantially constrained in the future, which won’t help future consumption growth.
What does this mean here in the United States?
In the short term, probably not much. It remains to be seen if this is a normal correction (which is possible) or something worse. If the latter, the effect on the U.S. would depend on the consequences in China—most likely, slower growth, corporate bankruptcies, and general disruption. This might upset U.S. supply chains and slow growth, but the effects here would be relatively minor.
The real potential for damage would be financial contagion. The sheer size of the Chinese economy means that even minor disruptions could cause considerable turmoil. Emerging markets, already on edge from a strengthening dollar, would get hit worst by Chinese turbulence, and the damage for Europe could be serious as well, given the generally weak economic conditions there. Nonetheless, considering the high level of Chinese reserves and the relatively limited financial links between China and the rest of the world, the damage would probably be contained, at least here in the U.S.
China’s faltering stock market presents real risks, but at this point, we don’t know whether it will turn out to be a problem at all, much less a severe one. Although U.S. markets seem to be riding out the Greek crisis just fine, and ignoring the Chinese markets, more volatility is possible.
The fundamentals, however, remain supportive, so there’s no need for panic—just thoughtful concern.


 Print
Print


