The Independent Market Observer

Brad McMillan, CFA®, CFP®

Brad McMillan, CFA®, CFP®, is managing principal, wealth management, and chief investment officer at Commonwealth. As CIO, Brad chairs the investment committee and is a spokesperson for Commonwealth’s investment divisions. Brad received his BA from Dartmouth College, an MS from MIT, and an MS from Boston College. He has worked as a real estate developer, consultant, and lender; as an investment analyst, manager, and consultant; and as a start-up executive. His professional qualifications include designated membership in the Appraisal Institute, the CFA Institute, and the CAIA Association. He also is a CERTIFIED FINANCIAL PLANNER™ practitioner. Brad speaks around the country on investment issues and writes for industry publications, as well as for this blog.
Find me on:

Recent Posts

9/12/13 – Illiquid Asset Classes: Real Estate

September 12, 2013

This is the third installment in a series on alternative asset classes and your portfolio. The first covered strategies that use liquid underlying assets like stocks and bonds, which are freely tradable. Yesterday, we talked about how illiquid asset classes can also fit into a portfolio, with some examples, but didn’t really delve into details. Today, I want to discuss real estate as an example of an asset class that can be used in both liquid and illiquid forms.

The liquid form is known as a real estate investment trust, or REIT for short. REITs are publicly traded and are essentially stocks in every way except for the underlying asset, which is a portfolio of commercial real estate buildings, mortgages, or both. Investopedia offers a pretty good definition of REITs.

Continue reading → Leave a comment

9/11/13 – Illiquid Strategies and Your Portfolio

September 11, 2013

Following on yesterday’s post, we’ll continue looking at various types of alternative strategies that you might consider using in your portfolio. Since “alternative” covers a multitude of sins, I thought it would be useful to offer a brief overview of some of the strategies that fall under that umbrella.

Yesterday, we talked about long-only strategies, which we define here at Commonwealth as “core financial strategies,” and compared them with what we consider “alternative financial strategies.” Both use liquid underlying investments—that is, investments that can be freely bought and sold. The liquidity of the underlying investments is one of the principal determinants of whether a strategy is suitable for use in a mutual fund, which is where many of the strategies I discussed are being deployed.

Continue reading → Leave a comment

9/10/13 – Investment Strategies and Your Portfolio

September 10, 2013

I’m headed down to New York this morning to speak at a conference about alternative investing strategies, and it occurred to me that many investors have heard a great deal about alternatives—and perhaps know some of the fundamentals—but haven’t really looked at the types of strategies involved, why they might work, and how they are supposed to add value. Today, I want to focus on strategies that use liquid underlying investments (that is, investments that can be easily bought and sold), as these are the strategies that most investors will run into.

Long-only strategies
This type of strategy isn’t an alternative, but rather the baseline against which alternatives are judged. The idea here is to buy things—stocks or bonds—that will go up in price. Success depends to some extent on the manager’s ability to identify undervalued things to buy, but also to a great extent on how the market as a whole does. Returns don’t come only from price appreciation—coupon payments or dividends also contribute—but the price has to appreciate as well.

Continue reading → Leave a comment

9/9/13 – No News Is Good News?

September 9, 2013

My expectation, moving into September, was that all the economic issues that had been pretty much left alone during the summer would resurface. The debt ceiling, the situation in Europe, China—all would move back to the front pages.

Boy, was I wrong. Looking at today’s papers, I find no stories about economic problems on the front pages—none. The lead story is Syria, which makes sense. There’s also a story, in both the New York Times and the Wall Street Journal, with a retrospective of the financial crisis. Old news.

Continue reading → Leave a comment

9/6/13 - Market Thoughts for September 2013 Video

September 6, 2013

http://www.youtube.com/watch?v=Ahs1x1BfIyM 

Continue reading → Leave a comment

9/6/13 – The Employment Numbers and the Fed

September 6, 2013

I was in New York yesterday, meeting with clients and doing interviews, and the one thing everyone wanted to talk about was the employment numbers—the initial unemployment claims earlier in the week and today’s employment figures. Looking at the commentary, one paper called today’s release “probably the most scrutinized employment report in recent history.” So, now that they’re out, it seems only fair to take a look at the numbers.

Continue reading → Leave a comment

9/5/13 – Data-Driven Decision Making

September 5, 2013

In my last two posts, about data points that really matter, an implicit assumption is that the data in question (house sales and auto sales) actually drives decisions. Surprisingly, this hasn’t always been the case in many fields. Until fairly recently, many decisions have been largely based on expectations, plausibility, and bias.

Medicine is a great example. I don’t mean to pick on health care—after all, it’s the source of the current gold standard for effectiveness studies, the double-blind clinical trial—but think about the current debate on medical costs. One of the principal arguments for the availability of cost reductions is that no one really knows which treatments are most effective for many problems. Surgery rates for back pain, for example, vary widely among regions—which wouldn’t be the case, I hope, if there were one clearly superior solution. An entire industry, pharmaceuticals, is built around rolling out new treatments that, in many cases, offer little measurable benefit over existing treatments, at a much higher cost. Doctors hold onto their right to practice as they please, without regard for studies of industry best practices. The fact is, in many areas of medicine, we really don’t know what works best and why.

Continue reading → Leave a comment

9/4/13 – Data Points That Really Mean Something: Auto Sales

September 4, 2013

In yesterday’s post, I discussed why I think both house sales and car sales are good indicators for the economy’s performance over the next 6–12 months. I went into some detail about the housing market and why I believe it will continue to support growth; today we’ll do the same for auto sales.

To recap a bit, anyone buying a car is making a long-term commitment, as well as a long-term bet on his or her own earning power. To be willing to make the commitment is to have confidence in the future. At the same time, since most autos are bought with financing, a lender must also have confidence in the future. Rising auto sales therefore reflect both consumer and business confidence, and are based on what people are really doing at a given point in time, without much room for interpretation or adjustment.

Continue reading → Leave a comment

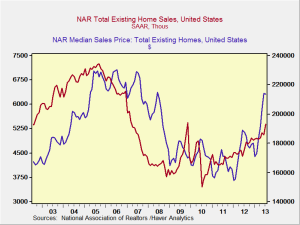
9/3/13 – Data Points That Really Mean Something: Housing

September 3, 2013

I wrote Commonwealth’s monthly market update this morning, and one of the topics I covered was the slowdown in the housing recovery. To be sure, I think this is just a slowdown to a more sustainable level of growth, but looking at it made me think about what I really consider some of the best indicators for future economic performance.

As you know, consumer spending represents more than two-thirds of the economy as a whole, so the consumer is paramount when considering where we’re going. We have multiple surveys of consumer confidence, which remains at high levels, and many data points on how much consumers are spending, but each of these is subject to revision, massaging, assumptions, and everything else that goes into the economic-statistics sausage grinder. It can be tough to see anything through the fog. What we need are simpler, easier data points that reflect underlying consumer demand in a clearer way.

Continue reading → Leave a comment

8/30/13 – Seeing Around the Corner

August 30, 2013

I had an interesting talk with a reporter for a major newspaper yesterday about the debt ceiling issue. She wanted to know what we were doing about it and what changes if any we were making to our allocations.

Continue reading → Leave a comment

Subscribe via Email

AI_Community_Podcast_Thumb - 1


Episode 9
July 23, 2025

Episode 8
June 18, 2025

Episode 7
May 14, 2025

Episode 6
April 23, 2025

More


Hot Topics


New Call-to-action

Archives

see all

Subscribe


Disclosure

The information on this website is intended for informational/educational purposes only and should not be construed as investment advice, a solicitation, or a recommendation to buy or sell any security or investment product. Please contact your financial professional for more information specific to your situation.

Certain sections of this commentary contain forward-looking statements that are based on our reasonable expectations, estimates, projections, and assumptions. Forward-looking statements are not guarantees of future performance and involve certain risks and uncertainties, which are difficult to predict. Past performance is not indicative of future results. Diversification does not assure a profit or protect against loss in declining markets.

The S&P 500 Index is a broad-based measurement of changes in stock market conditions based on the average performance of 500 widely held common stocks. All indices are unmanaged and investors cannot invest directly in an index.

The MSCI EAFE (Europe, Australia, Far East) Index is a free float‐adjusted market capitalization index that is designed to measure the equity market performance of developed markets, excluding the U.S. and Canada. The MSCI EAFE Index consists of 21 developed market country indices.

One basis point (bp) is equal to 1/100th of 1 percent, or 0.01 percent.

The VIX (CBOE Volatility Index) measures the market’s expectation of 30-day volatility across a wide range of S&P 500 options.

The forward price-to-earnings (P/E) ratio divides the current share price of the index by its estimated future earnings.

Third-party links are provided to you as a courtesy. We make no representation as to the completeness or accuracy of information provided on these websites. Information on such sites, including third-party links contained within, should not be construed as an endorsement or adoption by Commonwealth of any kind. You should consult with a financial advisor regarding your specific situation.

Member FINRASIPC

Please review our Terms of Use

Commonwealth Financial Network®