 I held a client webinar yesterday that included a look at housing demand. As part of my commentary, I made the point that housing is actually an excellent leading indicator for the rest of the economy and a key part of any future growth. At that point, I realized I had not done a detailed update on this topic in the blog for some time—so here we go.
Why housing is an excellent leading indicator
The reason housing is important as a leading indicator is that it captures a large subset of the overall economy.
On the demand side, consumers who buy a house are committing to long-term payments that are a substantial part of their income. (For many, a house is the largest purchase they will ever make and the mortgage their biggest expense.) This move takes confidence in their future prospects; therefore, it is an excellent indicator of just how confident consumers are, and that, in turn, is a very good indicator of their future spending plans.
On the supply side, housing captures the financial sector of the economy, which makes loans, and the real sector of the economy, which builds the houses; therefore, it incorporates employment, interest rates, and commodities in one place.
With all of the different elements in the mix, we have an equally rich mix of data to evaluate when we look at the housing industry. Let’s start with the demand side.
Household formation
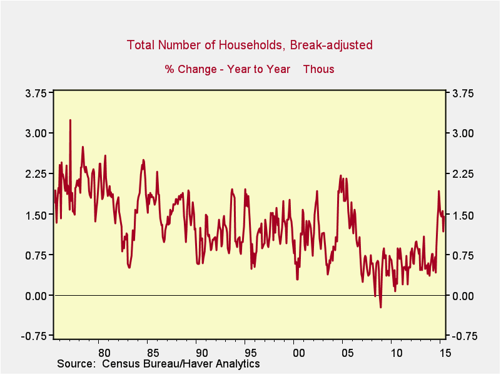
Demand for housing is ultimately driven by household formation. During the financial crisis, households grew slowly, as many millennials who couldn’t get a job ended up living with their parents or other roommates. This situation appears to be changing, as evidenced by the chart below, which illustrates the annual change in household creation.

In the past year, with the recovery in employment, you can see that household creation has moved back up to the levels of the 1990s, although not to the levels of the mid-2000s. You can also see that we are coming off of eight years of below-normal household formation. I take away the following:
- The mid-2000s were abnormal, driven by the housing boom, so I am not concerned that we have not matched that level.
- The current level is reasonable and sustainable based on the average levels of the past 40 years.
- Given the pent-up demand implied by the below-average formation of the past eight years, current household formation levels are not only sustainable, but very probably likely to accelerate.
Demand is therefore reasonably solid for the foreseeable future and may well improve.
Affordability
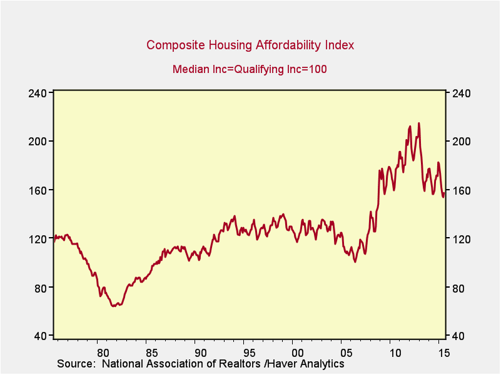
How about effective demand? Can these people actually afford to buy? One way to look at this is to incorporate mortgage rates, housing prices, and average incomes into one model, which is exactly what the Housing Affordability Index does.

The way this is calculated, at 100 the median family income can afford an 80-percent loan-to-value mortgage on a median home. As you can see, while affordability is down somewhat from the peak, due to higher house prices, housing is still more affordable than at any time in the past 40 years—except for the past eight. Again, housing is more affordable than in the 1980s, 1990s, or 2000s. Effective demand should therefore also not be a problem, as the average family can now afford about a house and a half.
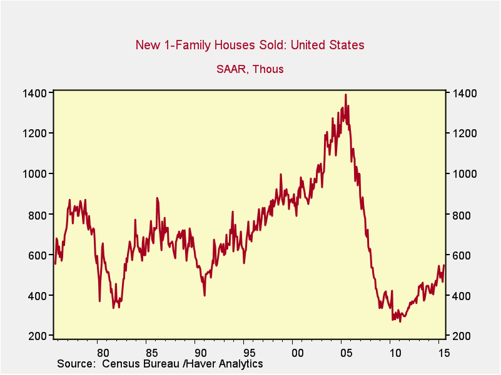
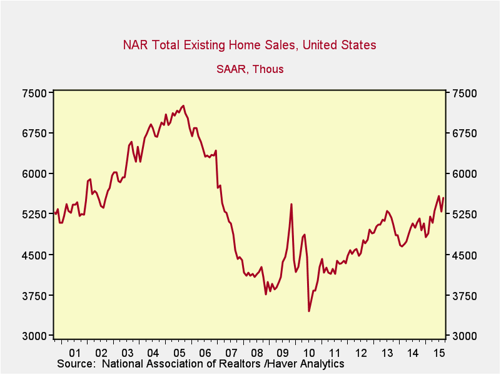
Finally, if we look at how this is translating into actual sales, we see these factors at work.
New and existing home sales
New home sales. New home sales have grown, but, despite doubling off the base, they are still below average levels from previous decades. This is due, apparently, more to lack of supply than lack of demand. In any case, the fact that new sales have been growing, but are still below previous levels, suggests again that current demand is not only sustainable but likely to accelerate.

Existing home sales. These tell the same story. This is a shorter data series, but current sales levels are at about the level of 2001, after the dot-com bust. Although we see the boom in 2005 and 2006, higher levels before then suggest that there is room here for sales to increase well above current levels—and the pent-up demand from the past eight years suggests that might happen.

From a demand standpoint, therefore, housing continues to thrive and looks likely to improve even further. Tomorrow we will take a look at what that means for the supply side of the housing market and the larger economy.


 Print
Print


