 In yesterday’s post, I reviewed the market data—including valuations, changes in margin debt, and changes in the market cap as a percentage of GDP—for some potential signals of a market crash. All seemed to provide valuable insight but were certainly not definitive. Part of the problem is that these signals can give false alarms or give correct signals that nonetheless result in only minor downturns. So, another set of filters is needed to help refine the analysis.
One promising source of data is the economy itself. Presumably, an economic downturn would fundamentally amplify any trends from the market itself; therefore, looking for signs of economic trouble could potentially provide valuable market information. Let’s take a look.
Recessions and market downturns
Over the past 30 years, when the market has dropped below its level from the prior year, a recession has happened shortly thereafter. This isn’t a perfect indicator, with false alarms in the late 1980s and 1990s, but it is reasonably good, as we can see below.
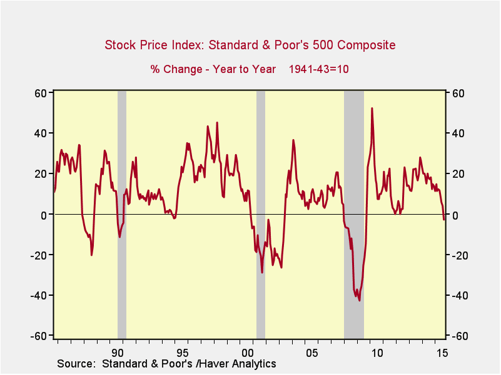
For our purposes here, however, the causality is reversed: we want a signal of a market downturn, not a signal of a recession. (It does raise the possibility of using recession leading indicators as market downturn indicators.) Therefore, let’s take a look at some of the economic indicators I use to see what they have to say.
Employment changes
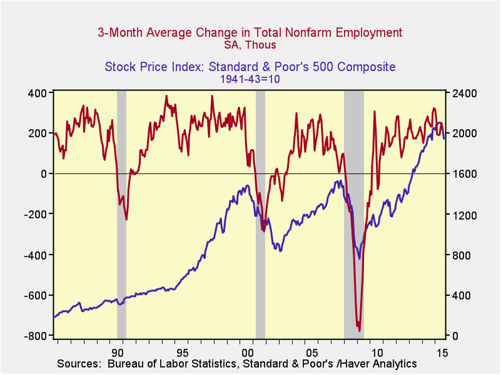
In the chart below, we can see that when job creation drops significantly from the previous year’s level, it’s a good leading indicator of both a recession and a significant market downturn. It worked in 1990, 2000, and 2008, but it missed the 1987 downturn. Right now, employment has grown strongly over the past 12 months, indicating that both a recession and a significant market downturn are unlikely according to this indicator.
The yield curve
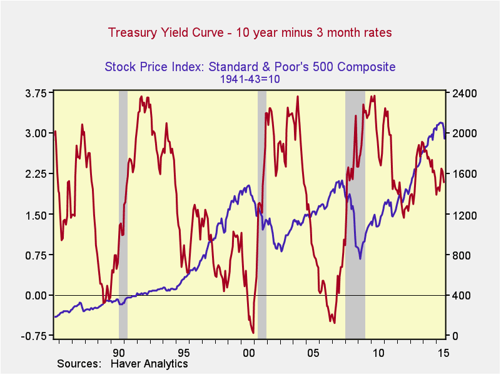
It can reasonably be concluded that rising rates affect the stock market. When short-term rates are higher than long-term rates, known as an inverted yield curve, we typically see a recession. Looking at the next chart, we can clearly see that an inverted yield curve has signaled the past three recessions. It has also signaled the 1990, 2000, and 2008 stock market downturns, but it again missed the 1987 crash. Right now, the rate differential is still very positive, suggesting a major downturn is unlikely, as Fed policy continues to be very stimulative.
Consumer confidence
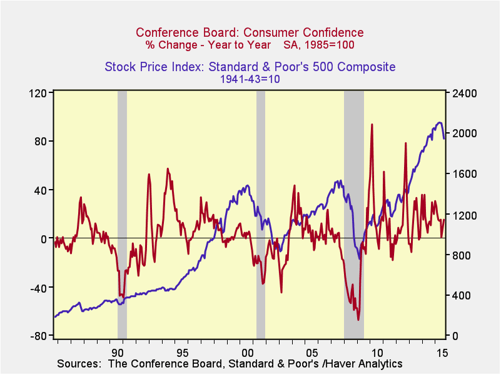
Changes in consumer confidence, in theory, should also provide a good indicator for both the economy and the markets. In practice, it is successful but provides many false signals. It caught the 1990, 2000, and 2008 downturns but missed 1987. Further, it indicated downturns in many other years in which downturns simply did not happen. Right now, this indicator is in healthy territory and suggests a major downturn is unlikely. Given the number of false signals, however, this should be considered only as a supporting indicator rather than a primary one.
What are the signals saying?
First, a major downturn, akin to 2000 or 2008, seems unlikely at this time. Economic conditions in the U.S., despite some weakening, remain favorable and are nowhere close to recession conditions. Although we may well see continued turbulence, while employment remains strong and the Fed continues to stimulate, strong fundamentals should support the market.
Second, 1987 is an outlier and deserves more consideration. Given the weak market indicators, discussed yesterday, the fact that the economic indicators missed the 1987 downturn means a more significant pullback certainly remains possible. Even here, though, the economic indicators provide valuable information. Not unlike the 2000 and 2008 downturns, the 1987 crash (although sharp) was also short and barely shows up on the charts today.
As I noted yesterday, the market indicators are mixed but definitely allow for the possibility of a more severe downturn. The economic indicators, however, are much more supportive; they suggest that even if the downturn gets worse—as it might—it should be relatively short lived.
No reason to panic
Of course, I am very aware of the possibility of further market losses and am tracking what might happen. But at the moment, and based on the data, I believe that the risk of a major, long-lived downturn like 2000 or 2008 is not high. Further economic and market deterioration would be necessary for such a result to become probable. Although such deterioration is certainly possible, it hasn’t happened yet. Let’s not panic until it does.


 Print
Print

