

 Print
Print After writing yesterday’s post on the price of oil, I thought it might be useful to take a longer-term look at the behavior of oil. I think this will provide some context to yesterday’s discussion, as well as to future developments. To start, let’s look at the price history over the past 30 years.
A history of oil prices
The chart below includes both U.S. and European trading prices, and you can see a couple of things clearly. First, prices have increased dramatically over the past three decades. Second, until quite recently, prices in Europe and the U.S. were almost identical. These are both issues that warrant further thought.
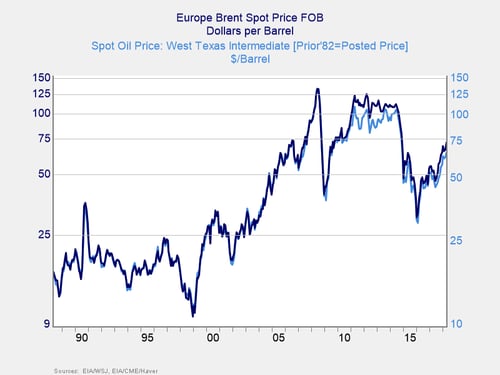
Price increase. On a nominal basis (i.e., in current dollars), the price has risen from about $16 per barrel to the current $66 per barrel, with spikes to more than $120 (on a monthly basis). That increase, however, includes substantial price inflation, and it does not reflect the real cost in terms of purchasing power. To get a better sense of that, I divided the oil price by the Consumer Price Index (CPI). By doing so, we get a much smaller increase in the real price—from about $16 per barrel to just more than $25 per barrel in constant dollars, an increase of 50 percent. Not nothing to be sure. But over 30 years, it is not all that terrible—and certainly less than what the nominal increase shows.
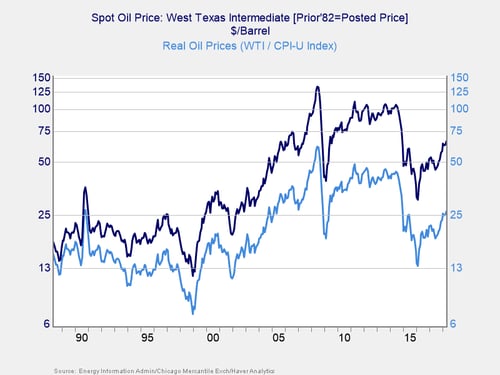
This relatively small increase in the real price helps explain why oil has remained central to energy generation and transportation. Oil simply remains relatively cheap. It also helps explain why the U.S. market remains dominated by SUVs and why auto mileage standards are on the verge of being repealed. From an economic standpoint, the need is not seen as outweighing the costs.
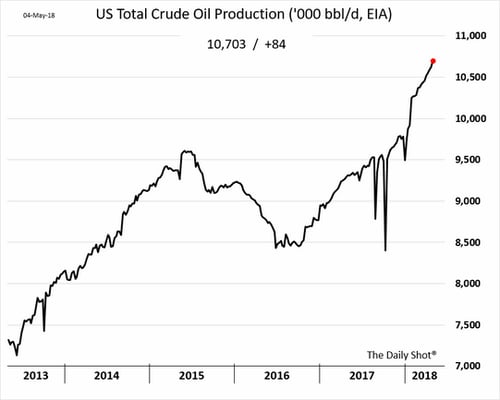
Prices in Europe and the U.S. The recent split between U.S. and European pricing is due to the growing glut in U.S. production, which has overwhelmed the pipeline infrastructure. When production surges here in the U.S., as it did in the early part of the decade and is doing now, there simply is too much oil to fit in the existing network of pipelines. As such, sellers are forced to take less and ship it by other methods (e.g., trucks). Note also the gap gets larger as prices rise, which is when U.S. production really takes off. This explains why we have seen the gap emerge once again in recent months.
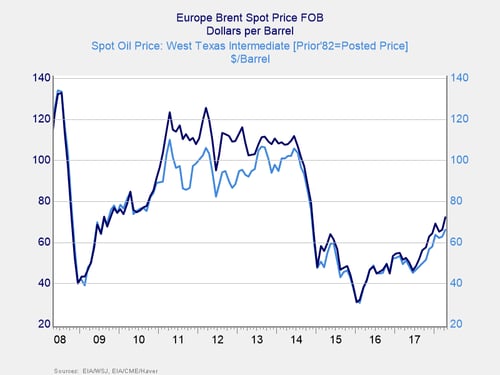
This trend is likely to get even more severe. With U.S. production taking off at an accelerating rate, we can expect to see the gap between West Texas Intermediate (WTI, U.S. price) and Brent (European price) continue to widen, potentially to the extent we saw in 2011–2013. U.S. prices are likely to increase with world prices (as I discussed in yesterday’s post) but will probably not rise by as much.
All of this, obviously, is relevant in light of yesterday’s discussion about risky price levels. When we consider economic risks, which oil price should we pay attention to—and why?
Keep your eye on WTI
The answer is that while world prices matter, U.S. prices are particularly important. Domestic producers have better access to, and are better able to take advantage of, those lower prices than foreign users. And this is the point: we need to watch WTI rather than Brent, which may buy us some more time before we get into the risk zone. From an economic perspective, here in the U.S., this is a good thing.
There are a couple of other points worth noting as well. The most significant is that U.S. producers are leaving quite a bit of money on the table by not being able to sell at world prices. Expect a gusher of investment in oil infrastructure, pipelines, and shipping facilities, to allow them to get Brent pricing. The gap should close over time. Second, with rising U.S. production, the influence of foreign producers on the U.S. market, already low by historical standards, is likely to decline even further, with geopolitical ramifications even more significant than we have already seen. That, however, is a topic for another day.
Have a great weekend!


