 Oil has been in the news quite a bit recently. Prices have risen to multiyear highs, and the recent decision by the U.S. to reimpose sanctions on Iran has rattled markets even further. We know that oil prices are a key risk indicator for the economy, but is it time to start worrying? Plus, what do higher oil prices mean—if anything—for the financial markets?
Short-term trend
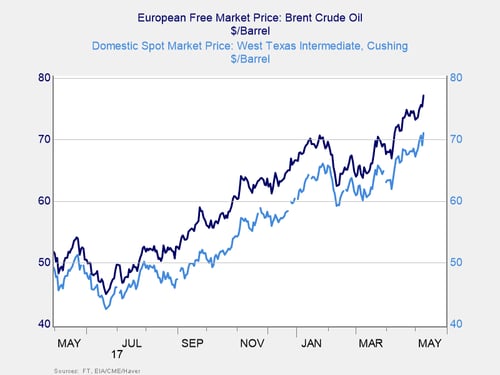
As you can see in the chart below, both U.S. prices (West Texas Intermediate) and European prices (Brent) have trended higher over the past year. So, we are definitely seeing an upward trend, and the difference—from around $50 per barrel to more than $70 per barrel—has also been significant.

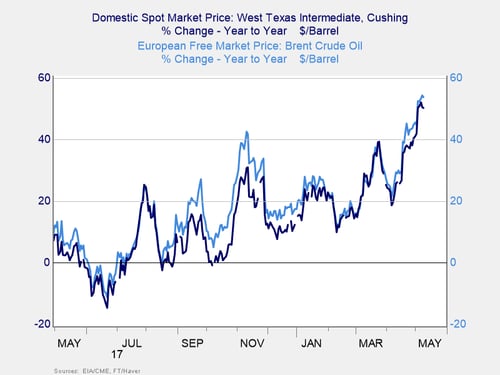
If we look at the annual percentage price changes, we also see a rise of between 20 percent and 50 percent. More important, we see the price increases are both ongoing (positive since October 2017) and accelerating (up from around 20 percent year-on-year a couple of months ago to about 50 percent now).

Longer-term view
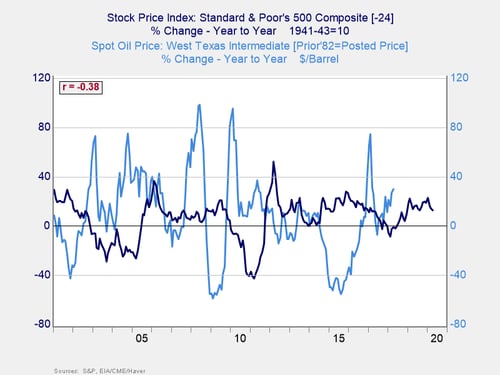
Over the past five years, we can see this trend has been consistent since 2015, including a spike at the end of 2016. Clearly, there is something going on in the oil markets—and it is something we need to pay attention to.

The big story here is that the structure of the industry is changing back to a more centralized one, which will give suppliers more power and which I wrote about last year. Since then, the process has moved further forward, and we can see the effects in the chart above. Note that this change has occurred even as U.S. production has continued to increase. This is a long-term structural change, not a short-term market fluctuation, and it is one that is likely to continue.
The upward trend in prices, then, is also likely to keep going for a while. This is a potential threat to the economy and financial markets. The question is, what will signal that the risk is becoming not only real but also imminent?
How to spot imminent risk
From an economic standpoint, the best way to spot imminent risk is when the price change rises above 80 percent, year-on-year. This has been a reliable signal of past recessions. So, for the moment, we are not close to the danger zone. We can tell, though, that with oil prices a year ago around $45 to $50 per barrel, the trouble zone is around $80 to $85 per barrel. If oil prices here in the U.S. get to that range, and stay there, it will be time to start looking for the economic risks to get much more serious.
For the financial markets, the situation is more complicated. While higher oil prices have a negative effect on the economy at a certain point, that takes time to kick in. In the meantime, energy companies are making more money, which can be positive for the market as a whole. In theory, that would mean oil price spikes would lead to a market pullback some time later.

In fact, that is exactly what happens, as you can see from the chart above, with about a two-year lag. Correlation is not causation, of course. But this makes theoretical sense, as well as being empirically correct. So, it is something we need to watch.
Where does this leave us?
There is no immediate concern, as price increases are still below the trouble zone. But we should watch for a target of $80 to $85 per barrel as a worry point. Once we get there, on a sustained basis, we then have a year or so before that starts to knock the market.
Of course, none of this is guaranteed. But it provides us with a structure to think about recent events and to plan for future outcomes. Short-term events might affect the price of oil, but it is the long-term trends that will ultimately drive economic and market risks. Those trends are indeed moving in the wrong direction, but the warning lights are not flashing yet.


 Print
Print

