 In yesterday’s post, I mentioned that lower government spending has been a big factor in the slow U.S. economic recovery. But it’s not the only culprit. Today, we'll take a look at three major headwinds to economic growth and whether they're likely to continue going forward.
1. Big cuts in government spending
For more than 50 years, from 1954 through 2010, U.S. government spending didn't decline. Then, in 2010, in response to decreased spending at the state and local levels and the sequester at the federal level, something almost unprecedented happened: spending actually dropped—a lot.
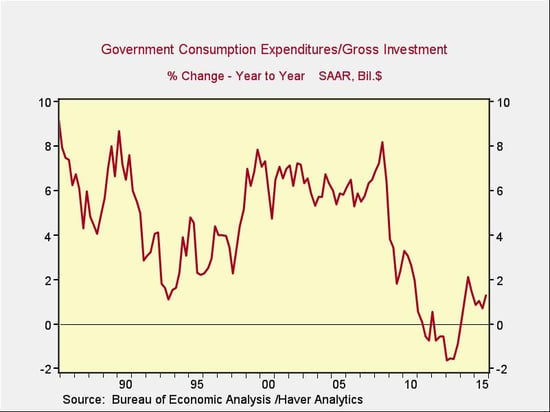
The decline from the levels of the 2000s is shocking. As you can see, from 2000 to 2007, government spending grew at a rate of around 6 percent per year. The decline in spending growth from 6 percent to less than zero knocked down overall economic growth significantly; as I said yesterday, this has been a key factor in the slow recovery. Had government spending continued at its 2005 growth rate, we wouldn’t be complaining about the economy right now.
In this sense, government is indeed the problem. A different slice of the data, however, suggests it’s not entirely responsible. If we exclude government spending and chart the growth of the private-sector economy, we see growth during this recovery of between 2.5 percent and 3.5 percent per year—not great, but significantly better than what is being reported.
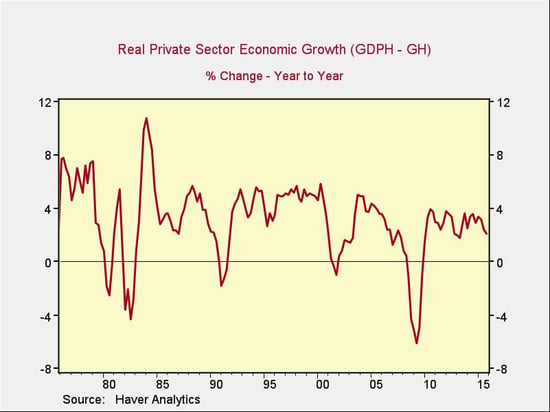
The trouble is that private economic growth is down significantly from the levels of the 1990s and 2000s. Real private-sector growth was in the 4- to 5-percent range in the 1990s and generally in the 3- to 4-percent range in the 2000s, suggesting that it may be slowing down from decade to decade. Why?
2. Mediocre wage growth
The lack of wage growth is one reason. As the chart below shows, the link between wage growth and private-sector economic growth is there.
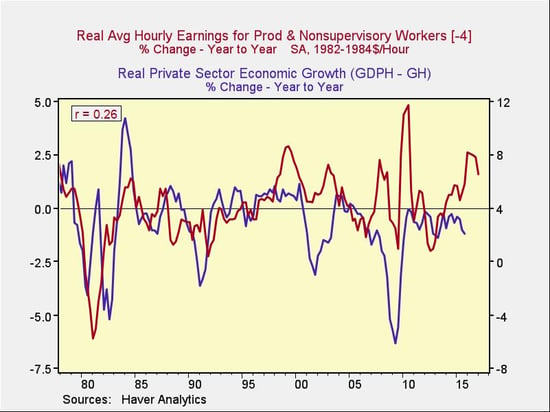
With a one-year lag, wage growth explains about a quarter of the change in private economic growth. This is actually encouraging. Given that wage growth has picked up over the past several quarters, this might well lead to faster private economic growth.
3. Slower population growth
Demographic changes are another factor. The correlation isn't high, but the trend is clear: slower population growth would seem to imply slower private economic growth.
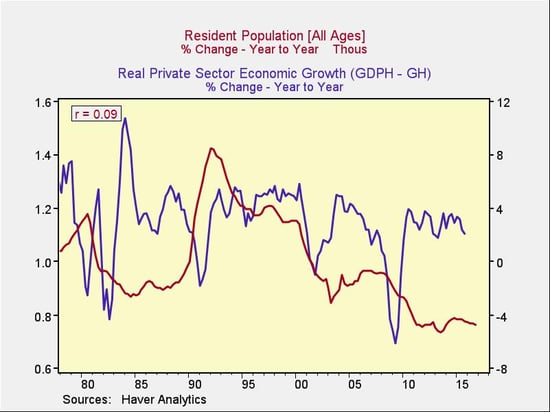
Slicing the data a bit more finely, however, shows that changes in the most economically active sector of the population, ages 25–54, have a higher correlation with private economic growth, which makes sense both empirically and theoretically.
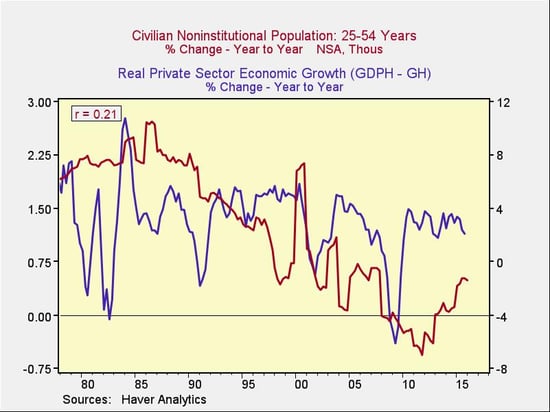
Here, too, the news is encouraging. Population growth in this cohort has returned to the levels of the 2000s, which may signal a higher growth rate ahead in the private-sector economy.
Headwinds show signs of abating
To sum up, the recovery has been held back by three major headwinds, all of which are reversing:
- Government spending is no longer declining and is quite likely to grow faster.
- Unfavorable wage growth and demographic factors, which account for almost half of private-sector economic growth, are moving in positive directions and are likely to keep doing so.
Based on this analysis, the outlook seems promising for overall economic growth. Although we’re not likely to see an immediate or substantial turnaround, the slow improvement is much more likely to continue, and even accelerate, than it is to stall.


 Print
Print


