

 Print
Print Yesterday, I wrote about how we’re approaching the 10th anniversary of the market bottom, when the S&P 500 touched 666 and then started to rebound. Today, I want to talk about a different market milestone: March 10, 2000 (19 years ago this weekend). That’s when the Nasdaq Composite, the tech index that exemplified the dot-com boom, peaked and started to decline.
My conclusion yesterday was that we should pay attention not so much to the differences between 2009 and the present but more to the similarities between previous booms and now. My premise for this reasoning is that if things look the same, they might be the same. So, on that basis, let’s take a look at 2000 and the present.
Valuations
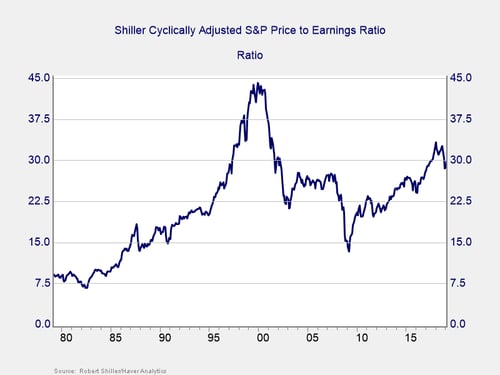
Stock market. There are a couple of ways to measure valuations, but I prefer the Shiller index, which looks at stock prices versus 10-year average earnings. While valuations are much lower now than they were in 2000, they are still higher than at any point in the past 40 years—even though they have pulled back a bit.
Price-to-sales ratio. Earnings are tricky, though. They can be manipulated, to some extent, through accounting, and they depend largely on factors such as interest rates and taxes. A purer way to look at valuations is to consider the price-to-sales ratio. Sales are what they are. Right now, this ratio confirms the high valuations shown in the Shiller chart. But the news is even worse: the current price-to-sales ratio is actually above what it was in 2000.
Consumer confidence
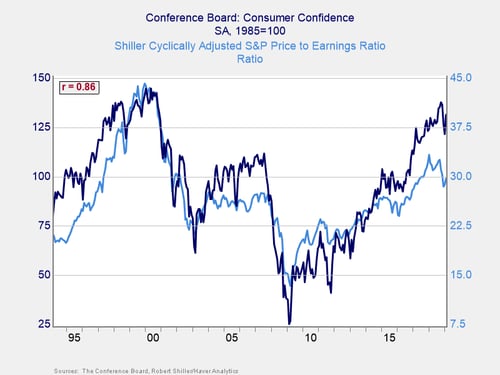
Another way to compare 2000 with the present is to look at consumer confidence. As you can see in the chart below, over the past 25 years, stock valuations have tracked very closely with confidence. When we look at the confidence number (the dark blue line), we see that confidence is at levels seen only at the peak of the dot-com boom. This alignment is also consistent with stock valuations now being at levels seen only during the dot-com boom. Once again, we have very positive conditions that correlate strongly with where we were in 2000—at the peak of peaks. If you take a closer look at the charts, you can also see the same correlation with where we were in 2008, although to a lesser degree. There are other metrics I could show you that would reveal the same thing.
As expected, there has been a fair bit of discussion around the 10-year anniversary of the bottom and much less about the 19-year anniversary of the top. One tells us how far we have come, and the other reveals how far we might fall. But I find the second much more useful as an investment manager and advisor.
Another break point coming?
Now, I reject the kind of calendar worship that looks for expiration dates on market or economic cycles. But, for fundamental reasons, we do tend to see cycles of around 10 years or so. The fact that we are looking at 10- and 19-year anniversaries suggests that it is certainly possible that another break point may be coming. It is also one more reason to look at 2000 as every bit as interesting and instructive as 2009.


